Help
Search CLIPdb
Input
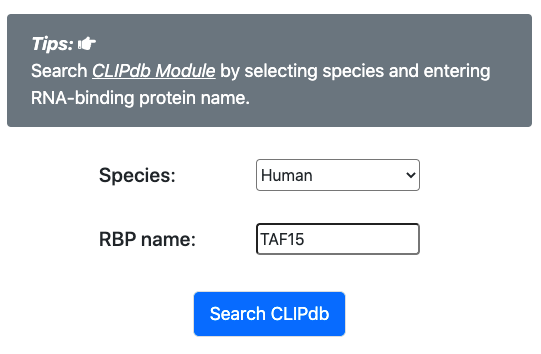
- Firstly, user should select a species (human, mouse, zebrafish, fly, worm, Arabidopsis, or yeast), and enter an RBP name of that species.
Result
Summary of RBP
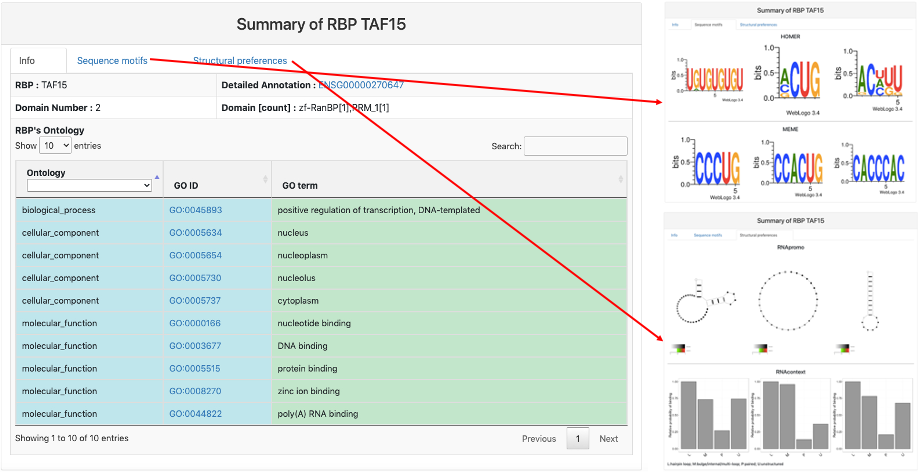
This section provides general information on the query RBP. It includes:
- RBP name.
- Detailed Annotation: geneID of the query RBP and a link to Ensembl database.
- Domain Number: total number of domains in the RBP from Pfam.
- Domain [count]: domains and their respective number from Pfam.
- RBP's Ontology: the GO annotation of the RBP about biological process, cellular component, and molecular function.
- Sequence Motifs: enriched sequence motif from Homer and MEME for the RBP binding region.
- Structural Preferences: enriched structural motifs from RNApromo and RNAcontext for the RBP binding region.
RBP binding sites
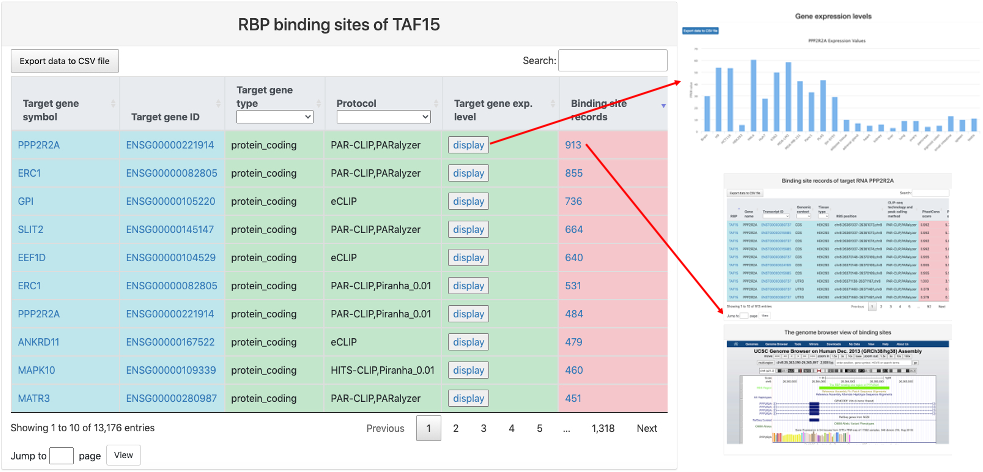
This section provides tabular view of binding sites for the query RBP. It includes:
- Target gene symbol.
- Target gene ID: gene ID of target RNA and a link to Ensembl database.
- Target gene type.
- Protocol: Experimental protocol and CLIP-seq peak caller used to identify binding sites between the query RBP and target gene.
- Target gene exp. level: a link to a bar chart of gene expression values of the target gene across different tissues and cell lines.
- Binding site records: a link to the table of all binding sites between the query RBP and the target gene with the same protocol and an embedded genome browser of the RBP binding region.
- RBP: RBP gene name and a link to the RBP summary webpage.
- Gene name: RNA gene name.
- Transcript ID: RNA transcript ID and a link to the Ensembl database.
- Genomic context: genomic context of the binding site.
- Tissue type: tissue type where the RBP binding sites were identified.
- RBS position: RBP binding site position in genome.
- CLIP-seq technology and peak calling method.
- PhastCons score: the mean conservation scores for the RBP binding sites using genome-wide phastCons intensities.
- Phylop score: the mean conservation scores for the RBP binding sites using genome-wide phyloP intensities.
- Score: RBP binding score calculated by the peak calling method.
- Data accession: data accession number and a link to the database.
- Overexpression info: information on whether the RBP was overexpressed or induced in the CLIP-seq experiment.
Here is an explaination of each column:
RBP binding on circRNA junction regions
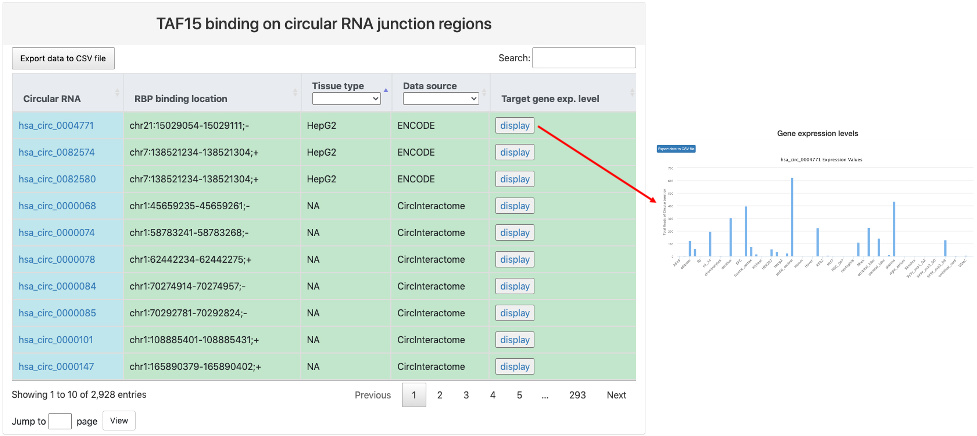
This section provides tabular view of RBP binding sites on circRNA junction regions identified by individual studies.
Here is an explaination of each column:
- Circular RNA: circBase ID and a link to the circBase database.
- RBP binding location: identified RBP binding location to the junction regions of the circRNA.
- Tissue type: tissue or cell line where identified RBP binding on circRNA junction regions took place.
- Data source: the source of the identified RBP binding on circRNA junction regions.
- Target gene exp. level: a link to a bar chart of gene expression values of the target circRNA across different tissues and cell lines.
Browse CLIPdb
Input
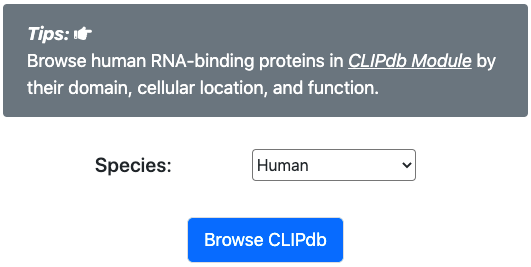
- User should specify a species (human) and click "Browse CLIPdb" to browse RNA-binding proteins in CLIPdb.
Result
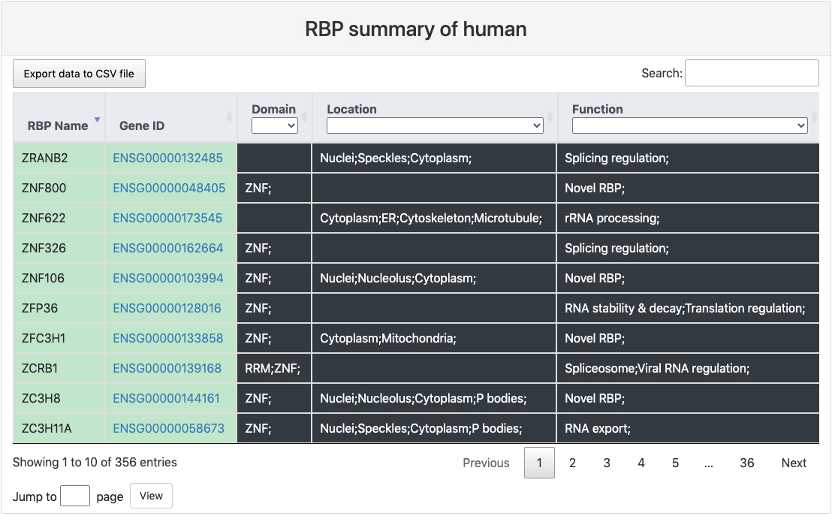
This section provides a tabular view of all the RBP in CLIPdb. It includes:
- RBP name: gene symbol of the RBP.
- Gene ID: gene ID of the RBP and a link to Ensembl database.
- Domain: curated protein domain of the RBP.
- Location: curated cellular location of the RBP.
- Function: curated biological function of the RBP.
Search linear RNA
Input
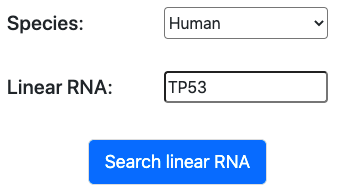
- Firstly, user should specify a species (human, mouse, zebrafish, fly, worm, Arabidopsis, or yeast), and enter an linear RNA name of that species.
Result
Gene Summary
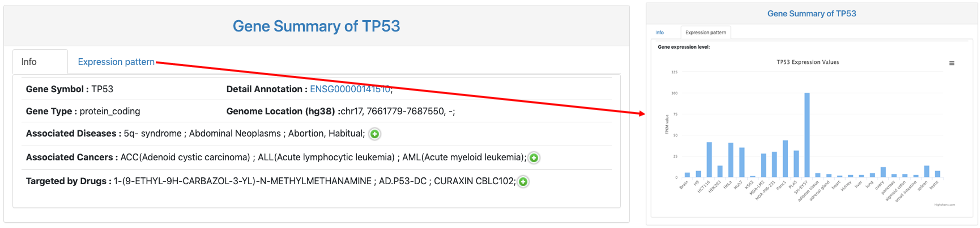
This section provides general information on the query RNA. It includes:
- Gene Symbol.
- Detail Annotation: gene ID of the query RNA and a link to Ensembl database.
- Gene Type.
- Genome Location.
- Associated Diseases: associated disease of input genes collected from OMIM and DisGeNET.
- Associated Cancer: associated cancer of input genes collected from 60 publications.
- Targeted by Drugs: target drugs collected from DGIdb.
- Expression pattern: a bar chart of gene expression values of the query gene across different tissues and cell lines.
RBP Binding Hotspots
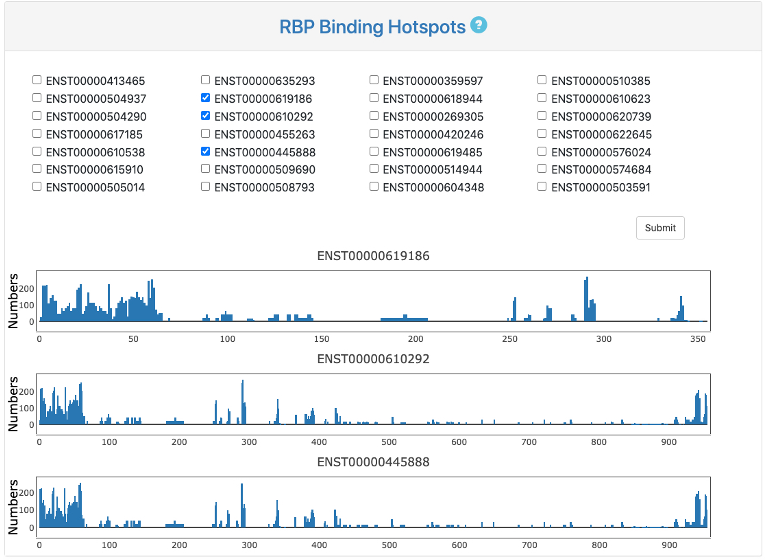
This section provides RBP binding hotspots, which indicate number of binding proteins in windows of 20nt along each pre-mRNA. Users could tick all transcripts of interest and click "submit" button. The RBP binding hotspots will appear below as a bar chart.
RBP Binding Sites
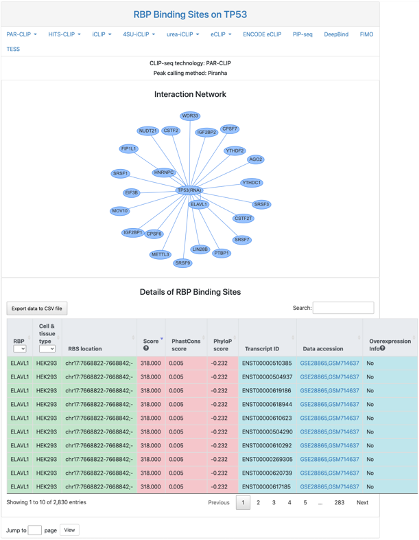
This section provides network and tabular view of RBP binding sites on the query RNA. Users should first click tabs to select desired CLIP-seq experiment protocol and analysis peak caller, then the corresponding network and data table will appear. It includes:
- Interaction Network: the interaction between the query RNA and other RBP in selected CLIP-seq protocol.
- Details of RBP binding sites: tabular view of RBP binding sites on the query RNA.
- RBP: RBP gene symbol.
- Tissue type: tissue type where the RBP binding sites were identified.
- RBS location: genomic location of the RBP binding site location.
- Score: RBP binding score calculated by the peak calling method.
- PhastCons score: the mean conservation scores for the RBP binding sites using genome-wide phastCons intensities.
- Phylop score: the mean conservation scores for the RBP binding sites using genome-wide phyloP intensities.
- Transcript ID: RNA transcript ID and a link to the Ensembl database.
- Data accession: data accession number and a link to the database.
- Overexpression info: information on whether the RBP was overexpressed or induced in the CLIP-seq experiment.
Here is an explaination of each column:
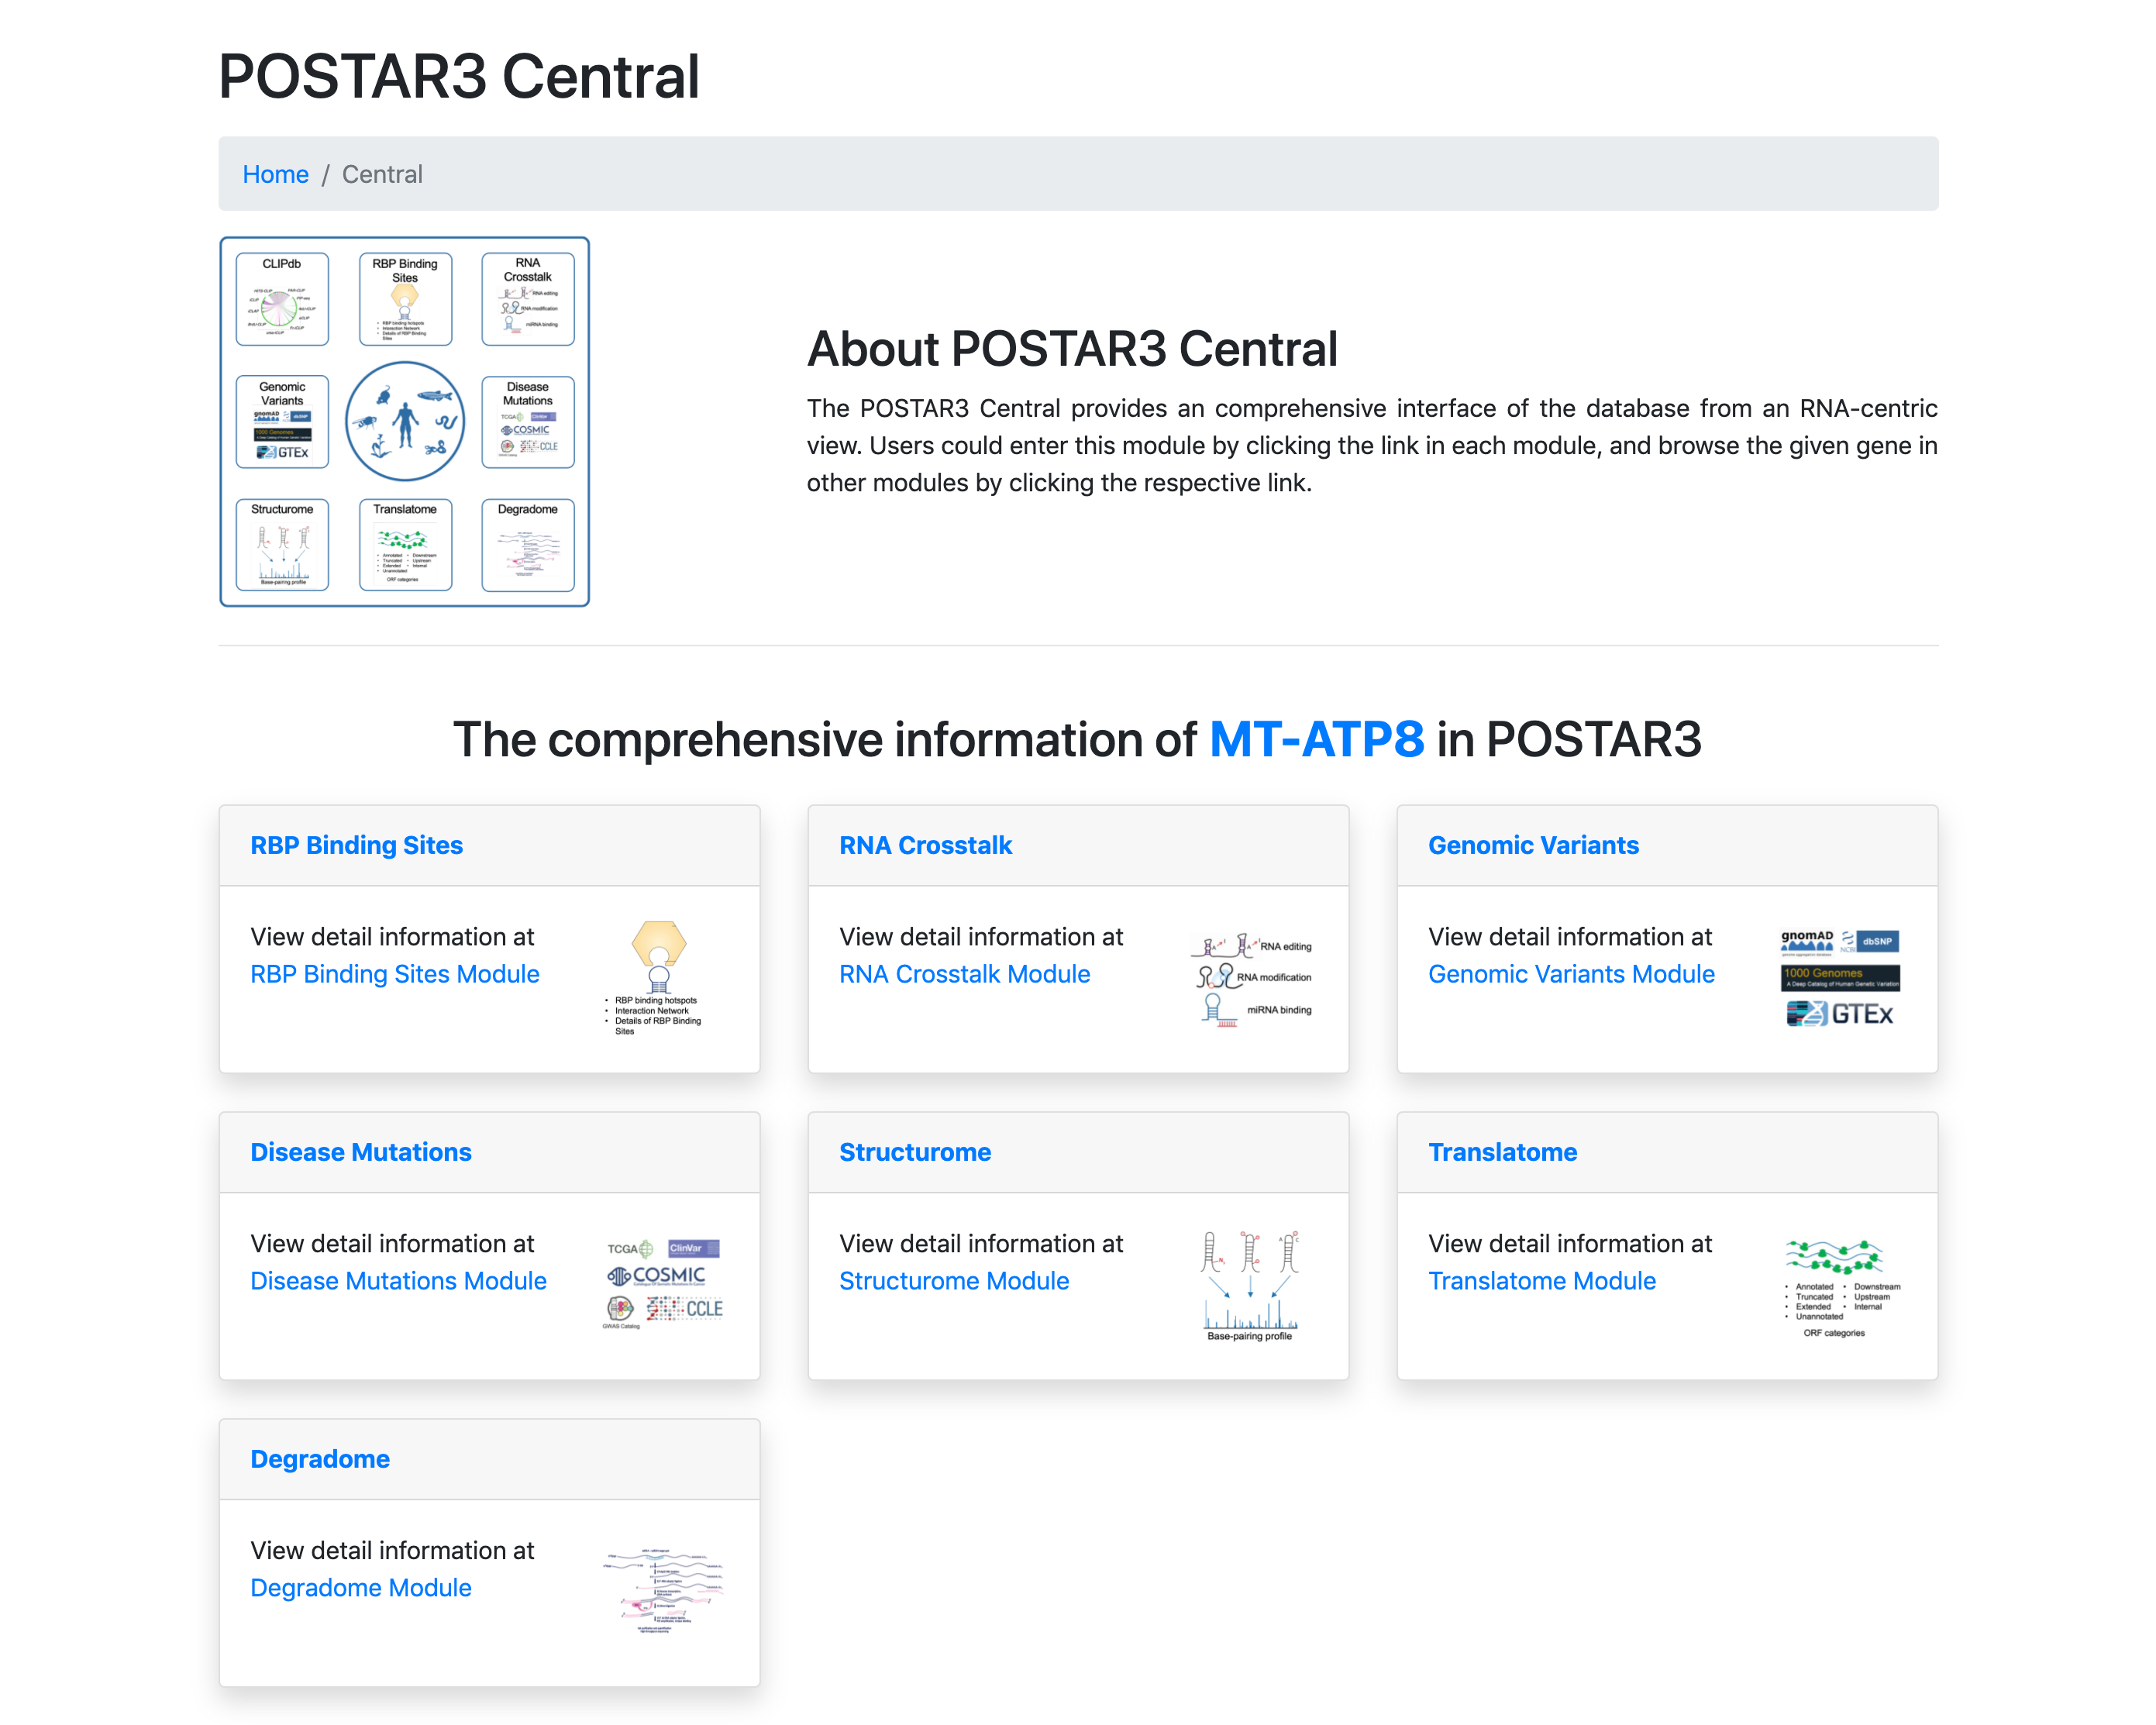
POSTAR3 Central

On the bottom of this module, we provided a link to a "POSTAR3 Central" web page, providing an RNA-centric view of our database. Users could transfer to other modules and search for the same gene in the same species by clicking the link in this page
Search circRNA
Input
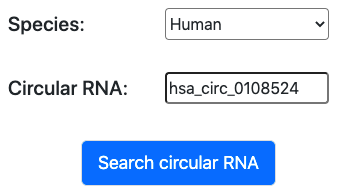
- Firstly, user should specify a species (human), and enter a circRNA name of that species.
Result
circRNA summary
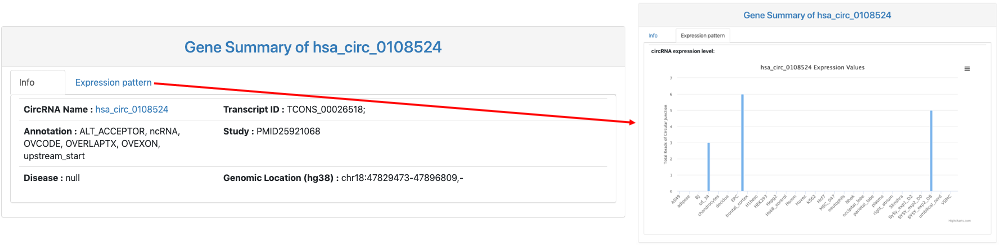
This section provides general information on the query circRNA. It includes:
- CircRNA Name: circBase ID and a link to circBase database.
- Transcript ID: transcript ID of circRNA.
- Annotation: circBase annotation for this circRNA.
- Study: studies that identified this circRNA.
- Disease: disease associated with this circRNA.
- Genomic Location.
- Expression pattern: a bar chart of circRNA expression values of the query circRNA across different tissues and cell lines.
RBP binding site on circRNA
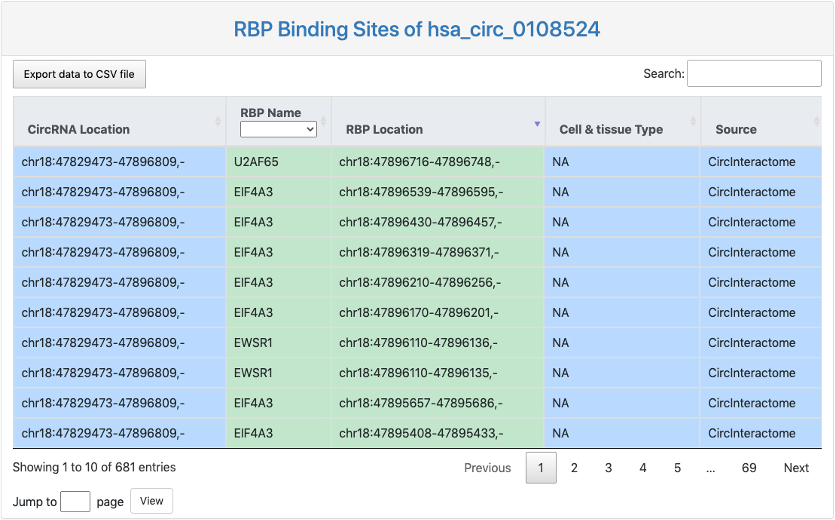
This section provides a tabular view of RBP binding sites on the queried circRNA junction regions.
Here is an explaination of each column:
- CircRNA Location: circRNA genome location.
- RBP Name.
- RBP Location: RBP binding location on the circRNA junction regions.
- Cell & tissue Type: tissue or cell line where identified RBP binding on circRNA junction regions took place.
- Data source: the source of the identified RBP binding on circRNA junction regions.
POSTAR3 Central
On the bottom of this module, we provided a link to a "POSTAR3 Central" web page, providing an RNA-centric view of our database. Users could transfer to other modules and search for the same gene in the same species by clicking the link in this page
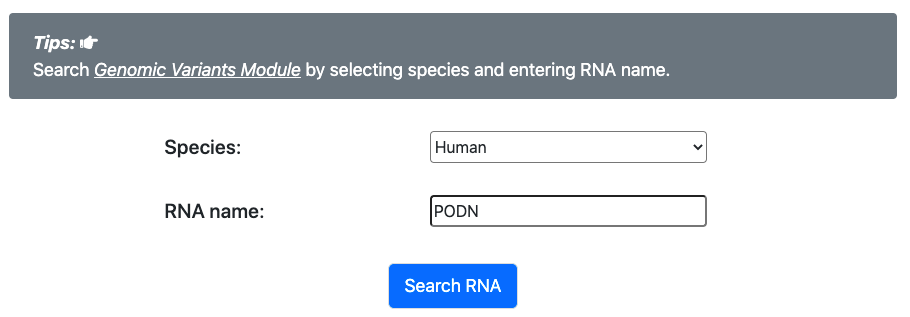
Input
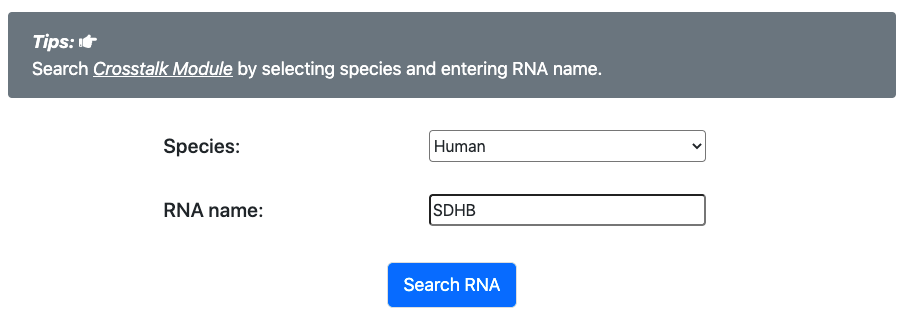
- Firstly, user should specify a species (human, mouse, zebrafish, fly, worm, Arabidopsis, or yeast), and enter an RNA name of that species.
Result
miRNA binding (experimental validated) within RBP binding sites
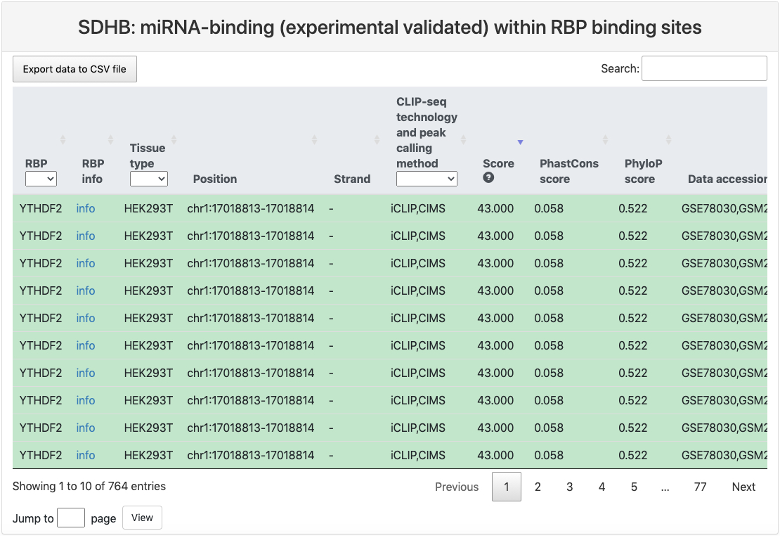
This section provides a tabular view of miRNA binding sites that have been experimentally validated within RBP binding sites.
Here is an explaination of each column:
- RBP.
- RBP info: a link to the summary page of this RBP.
- Tissue type: tissue type where the RBP binding sites were identified.
- Position: RBP binding site position in genome.
- Strand.
- CLIP-seq technology and peak calling method.
- Score: RBP binding score calculated by the peak calling method.
- PhastCons score: the mean conservation scores for the RBP binding sites using genome-wide phastCons intensities.
- Phylop score: the mean conservation scores for the RBP binding sites using genome-wide phyloP intensities.
- Data accession: data accession number of the CLIP-seq datasets.
- miRNA: miRNA miRBase ID.
- miRNA-binding sites: miRNA binding sites position on the RNA and a link to the genome browser.
- Binding energy: the binding energy with the unit of kcal/mol.
- Confidence: confidence score, and a larger score means stronger prediction confidence.
miRNA-binding (predicted) within RBP binding sites
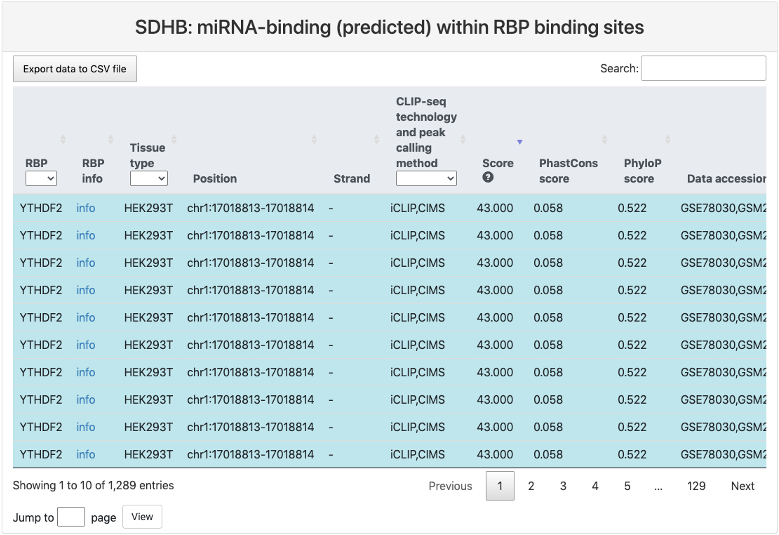
This section provides a tabular view of miRNA binding sites that have been experimentally validated within RBP binding sites.
Here is an explaination of each column:
The explainations of column 1-10 are the same of above table.
- miRNA: miRNA miRBase ID.
- miRNA-binding sites: miRNA binding sites position on the RNA and a link to the genome browser.
- Binding energy: the binding energy with the unit of kcal/mol.
- Prediction tool: the tool used to predict miRNA binding (miRanda and RNAhybrid for human, mouse, fly, and worm; psRobot and psRNAtarget for Arabidopsis).
- Confidence: For miRanda, larger score means stronger prediction confidence. For RNAhybrid, the score is the P-value of prediction. For psRobot and psRNAtarget, smaller score means stronger prediction condifence.
RNA modification within RBP binding sites
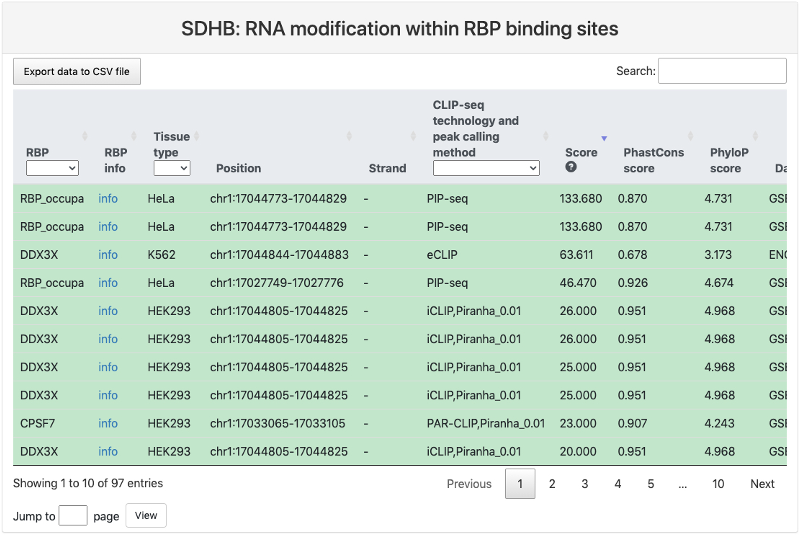
This section provides a tabular view of RNA modification sites within RBP binding sites.
Here is an explaination of each column:
The explainations of column 1-10 are the same of above table.
- Modification: type of RNA modification, including m1A (N1-methyladenosine), m5C (5-methylcytosine), m6A (N6-methyladenosine), Nm (2’-O-methylation) and PseudoU (Pseudouridine).
- RNA modification sites: the genomic location of the RNA modification site and a link to the genome browser.
- Support number: the number of supporting experiments.
RNA editing within RBP binding sites
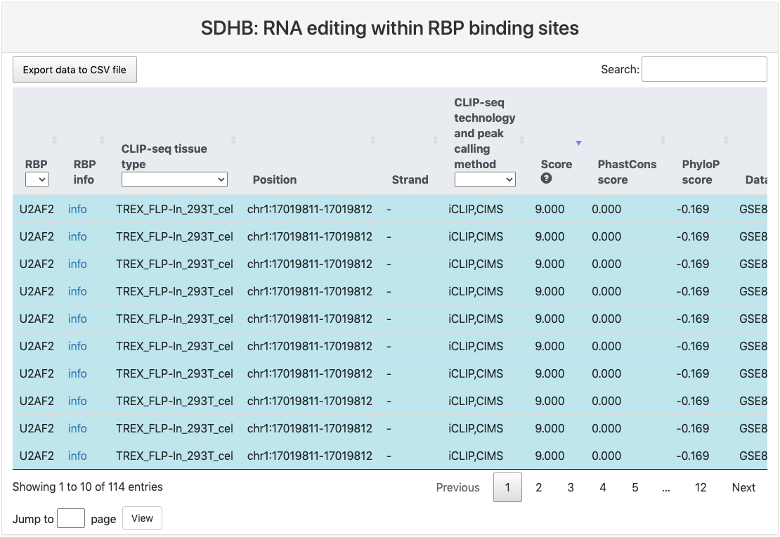
This section provides a tabular view of RNA editing sites within RBP binding sites.
Here is an explaination of each column:
The explainations of column 1-10 are the same of above table.
- RNA editing tissue type: tissue or cell line where the RNA editing event was identified.
- RNA editing sites: RNA editing position and a link to the genome browser.
- Level: The score from 0 to 1 to show the editing level.
POSTAR3 Central
On the bottom of this module, we provided a link to a "POSTAR3 Central" web page, providing an RNA-centric view of our database. Users could transfer to other modules and search for the same gene in the same species by clicking the link in this page
Input
- Firstly, user should specify a species (human, mouse, zebrafish, fly, worm, Arabidopsis, or yeast), and enter an RNA name of that species.
Result
dbSNP within RBP binding sites
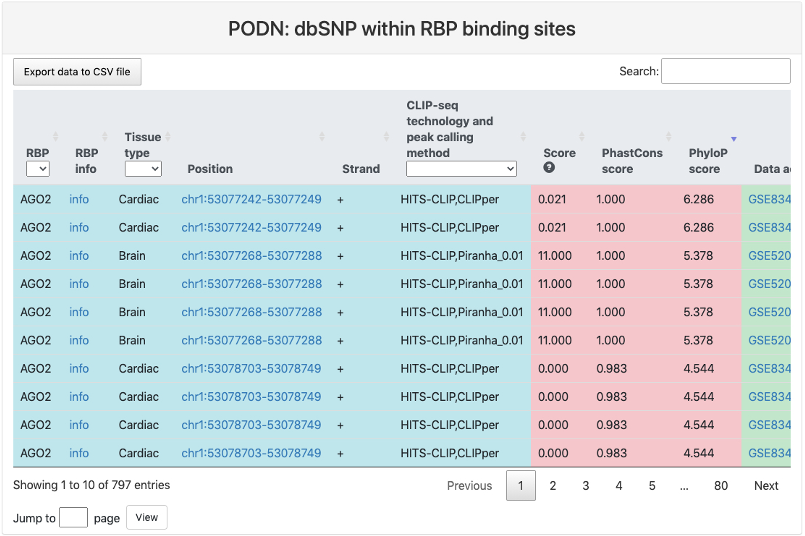
This section provides a tabular view of SNP sites from dbSNP within RBP binding sites.
Here is an explaination of each column:
- RBP.
- RBP info: a link to the summary page of this RBP.
- Tissue type: tissue type where the RBP binding sites were identified.
- Position: RBP binding site position in genome and a link to the genome browser.
- Strand.
- CLIP-seq technology and peak calling method.
- Score: RBP binding score calculated by the peak calling method.
- PhastCons score: the mean conservation scores for the RBP binding sites using genome-wide phastCons intensities.
- Phylop score: the mean conservation scores for the RBP binding sites using genome-wide phyloP intensities.
- Data accession: data accession number of the CLIP-seq datasets.
- Ref strand: reference genomic allele (+).
- Alt strand: corresponding alternative allele (+).
- SNP position: genomic location of the SNP site.
1KG within RBP binding sites
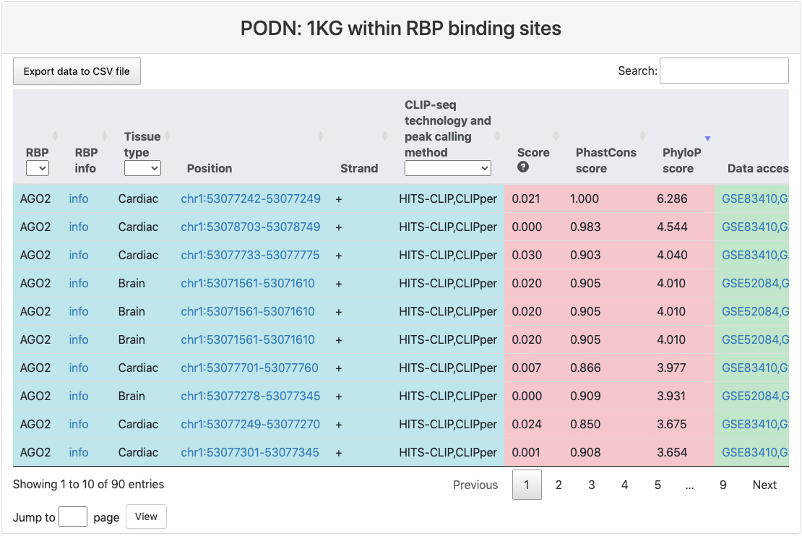
This section provides a tabular view of SNP sites from 1000 genomes within RBP binding sites. The explainations of each column are the same of above table.
gnomAD within RBP binding sites
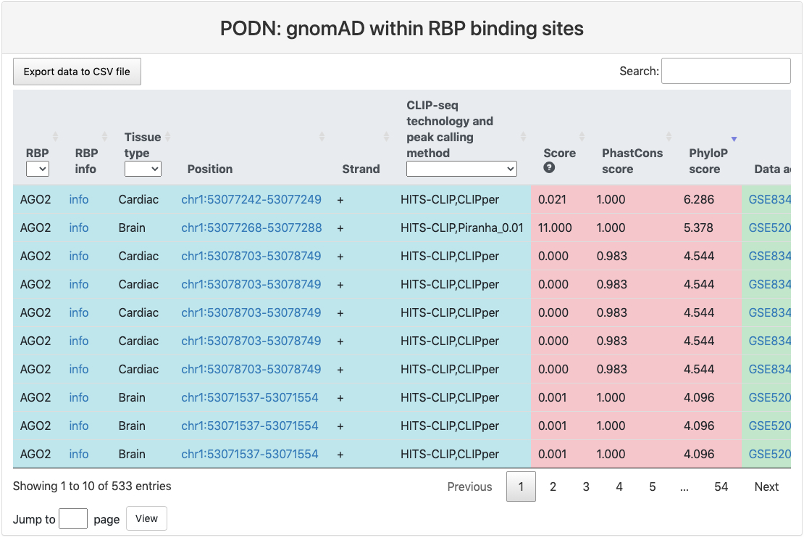
This section provides a tabular view of SNP sites from Genome Aggregation Database (gnomAD) within RBP binding sites. The explainations of each column are the same of above table.
eQTL within RBP binding sites
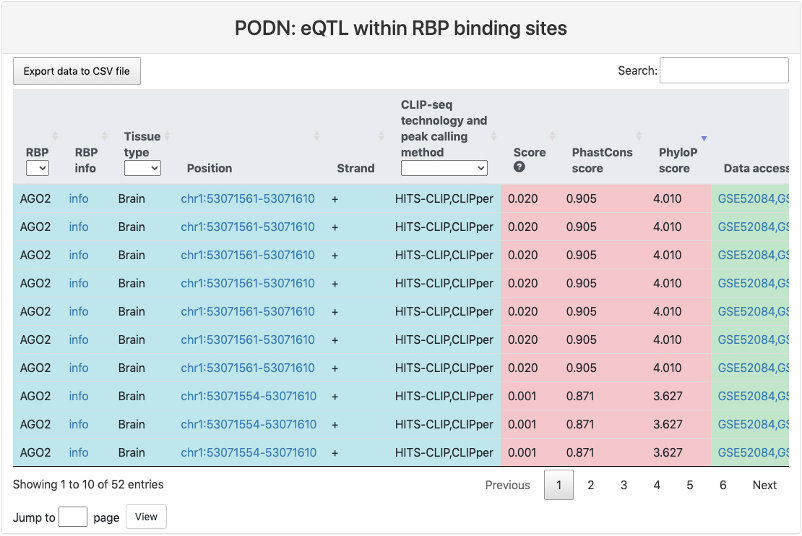
This section provides a tabular view of SNP sites from GTEx eQTL within RBP binding sites. The explainations of each column are the same of above table, except for the last column eQTL tissue type, where it represents the tissue type where the eQTL was determined.
sQTL within RBP binding sites
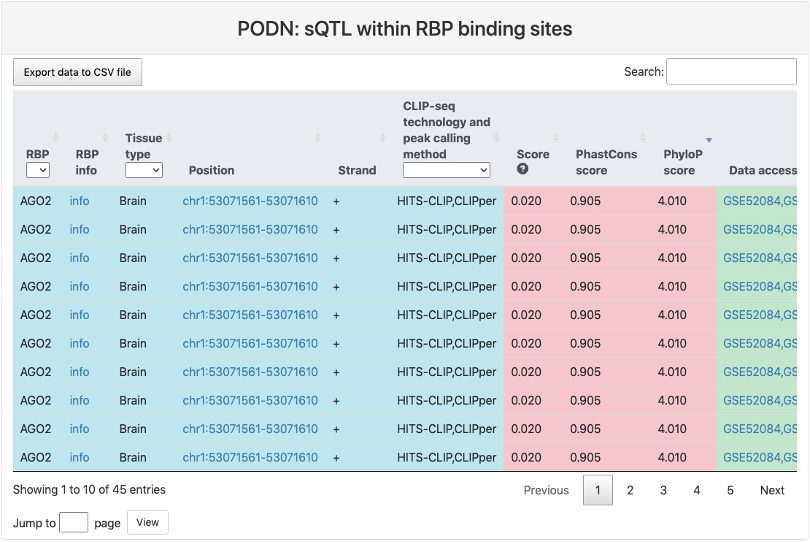
This section provides a tabular view of SNP sites from GTEx sQTL within RBP binding sites. The explainations of each column are the same of above table, except for the last column sQTL tissue type, where it represents the tissue type where the sQTL was determined.
POSTAR3 Central
On the bottom of this module, we provided a link to a "POSTAR3 Central" web page, providing an RNA-centric view of our database. Users could transfer to other modules and search for the same gene in the same species by clicking the link in this page
Input
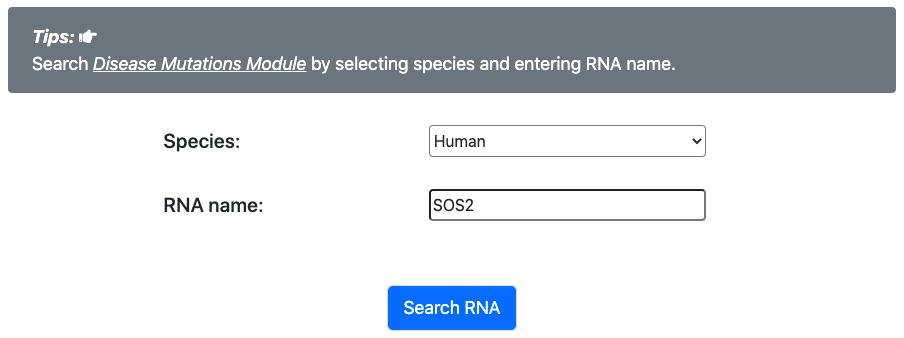
- Firstly, user should specify a species (human), and enter an RNA name of that species.
Result
GWAS SNPs within RBP binding sites
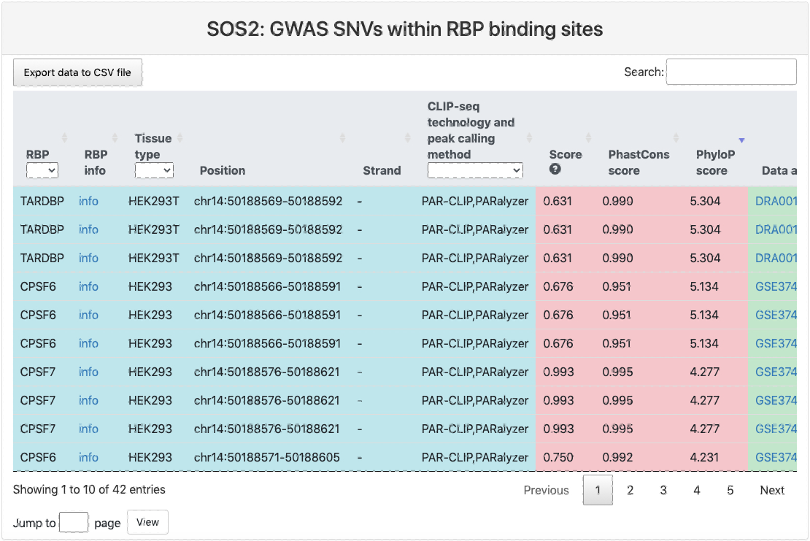
This section provides a tabular view of SNP sites from GWASdb within RBP binding sites.
Here is an explaination of each column:
- RBP.
- RBP info: a link to the summary page of this RBP.
- Tissue type: tissue type where the RBP binding sites were identified.
- Position: RBP binding site position in genome.
- Strand.
- CLIP-seq technology and peak calling method.
- Score: RBP binding score calculated by the peak calling method.
- PhastCons score: the mean conservation scores for the RBP binding sites using genome-wide phastCons intensities.
- Phylop score: the mean conservation scores for the RBP binding sites using genome-wide phyloP intensities.
- Data accession: data accession number of the CLIP-seq datasets.
- Ref: reference genomic allele (+).
- Alt: corresponding alternative allele (+).
- SNP position: genomic location of the SNP site.
- Disease Type: associated disease of the SNP.
ClinVar SNPs within RBP binding sites

This section provides a tabular view of SNP sites from ClinVar within RBP binding sites.
The explanations of column 1-10 are the same of above table. And the explanations of other columns are here:
- Ref: reference genomic allele (+).
- Alt: corresponding alternative allele (+).
- SNP position: genomic location of the SNP site.
- Disease Type: significance of this SNP in disease.
Cancer TCGA whole-genome SNVs within RBP binding sites
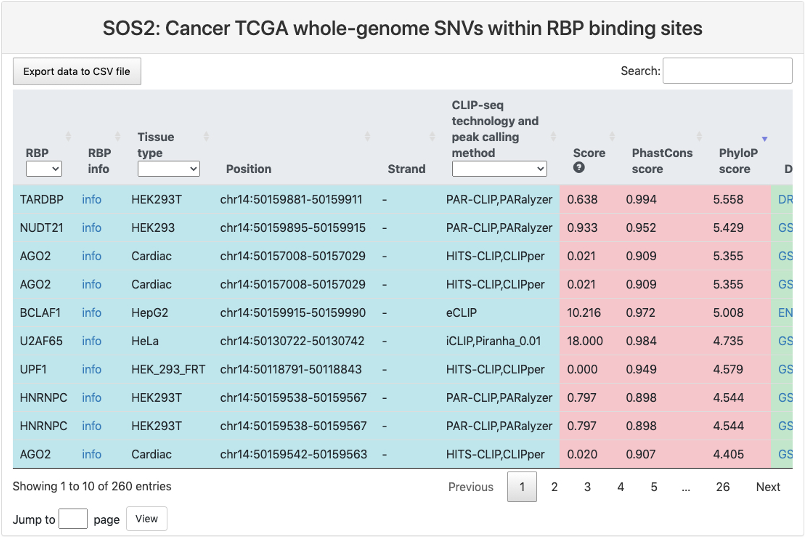
This section provides a tabular view of SNP sites from Cancer TCGA whole-genome within RBP binding sites.
The explanations of column 1-10 are the same of above table. And the explanations of other columns are here:
- Ref: reference genomic allele (+).
- Alt: corresponding alternative allele (+).
- Mutation position: genomic location of the SNP site.
Cancer TCGA whole-exome SNVs within RBP binding sites
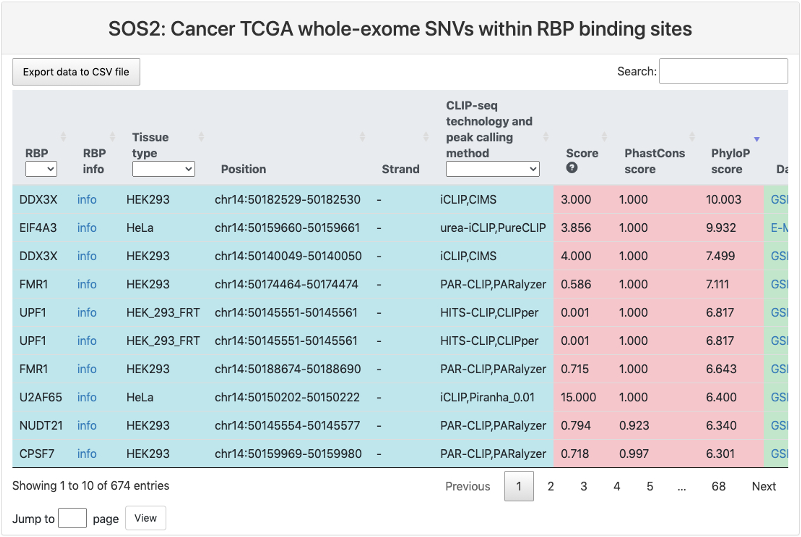
This section provides a tabular view of SNP sites from Cancer TCGA whole-exome within RBP binding sites.
The explanations of column 1-10 are the same of above table. And the explanations of other columns are here:
- Ref: reference genomic allele (+).
- Alt: corresponding alternative allele (+).
- Mutation position: genomic location of the SNP site.
Cancer COSMIC SNVs within RBP binding sites
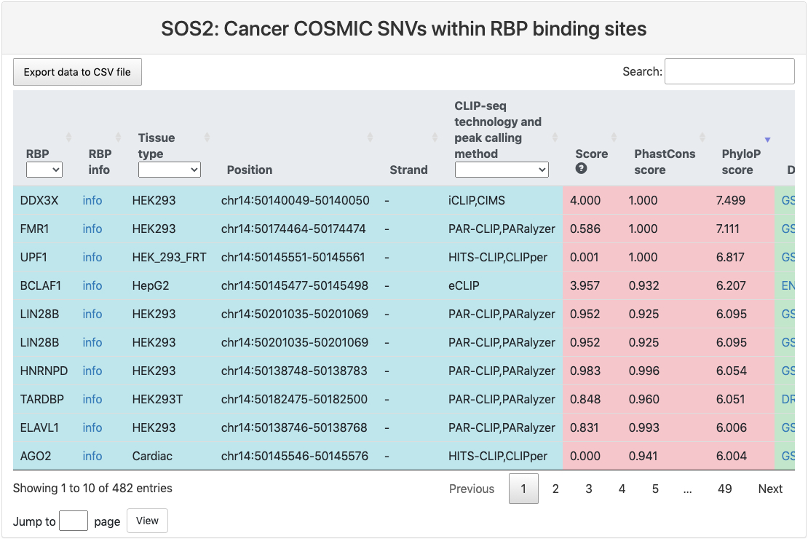
This section provides a tabular view of SNP sites from Cancer COSMIC within RBP binding sites.
The explanations of column 1-10 are the same of above table. And the explanations of other columns are here:
- Ref: reference genomic allele (+).
- Alt: corresponding alternative allele (+).
- Mutation position: genomic location of the SNP site.
Cancer Cell Line Encyclopedia SNVs within RBP binding sites
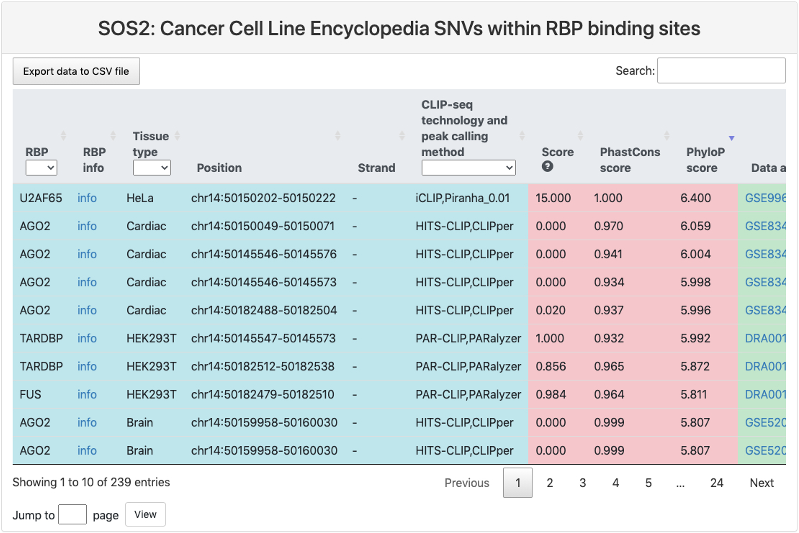
This section provides a tabular view of SNP sites from Cancer Cell Line Encyclopedia within RBP binding sites.
The explanations of column 1-10 are the same of above table. And the explanations of other columns are here:
- Ref: reference genomic allele (+).
- Alt: corresponding alternative allele (+).
- Mutation position: genomic location of the SNP site.
De novo SNVs within RBP binding sites
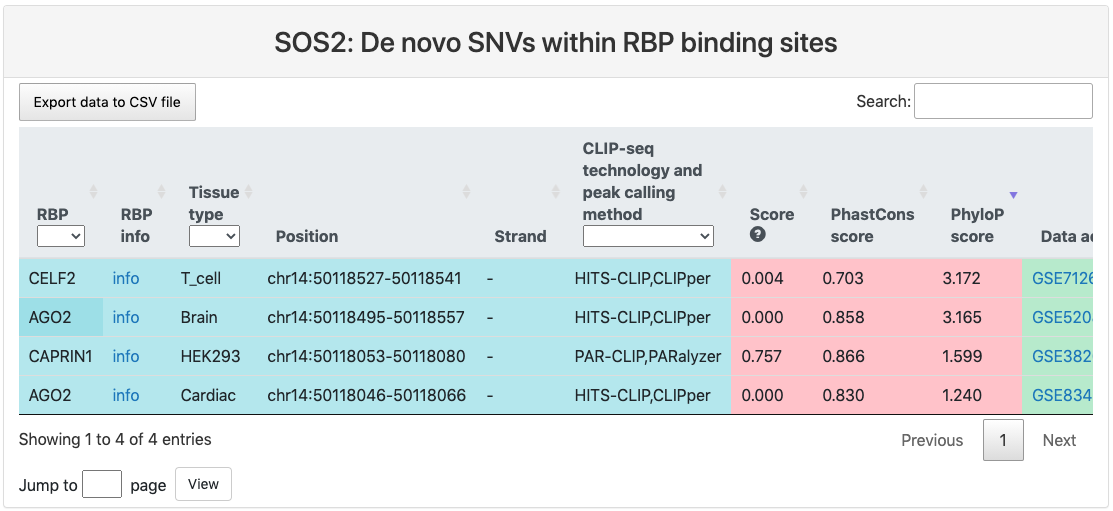
This section provides a tabular view of SNP sites from denovodb within RBP binding sites.
The explanations of column 1-10 are the same of above table. And the explanations of other columns are here:
- Ref: reference genomic allele (+).
- Alt: corresponding alternative allele (+).
- Mutation position: genomic location of the SNP site.
HmtDB SNVs within RBP binding sites
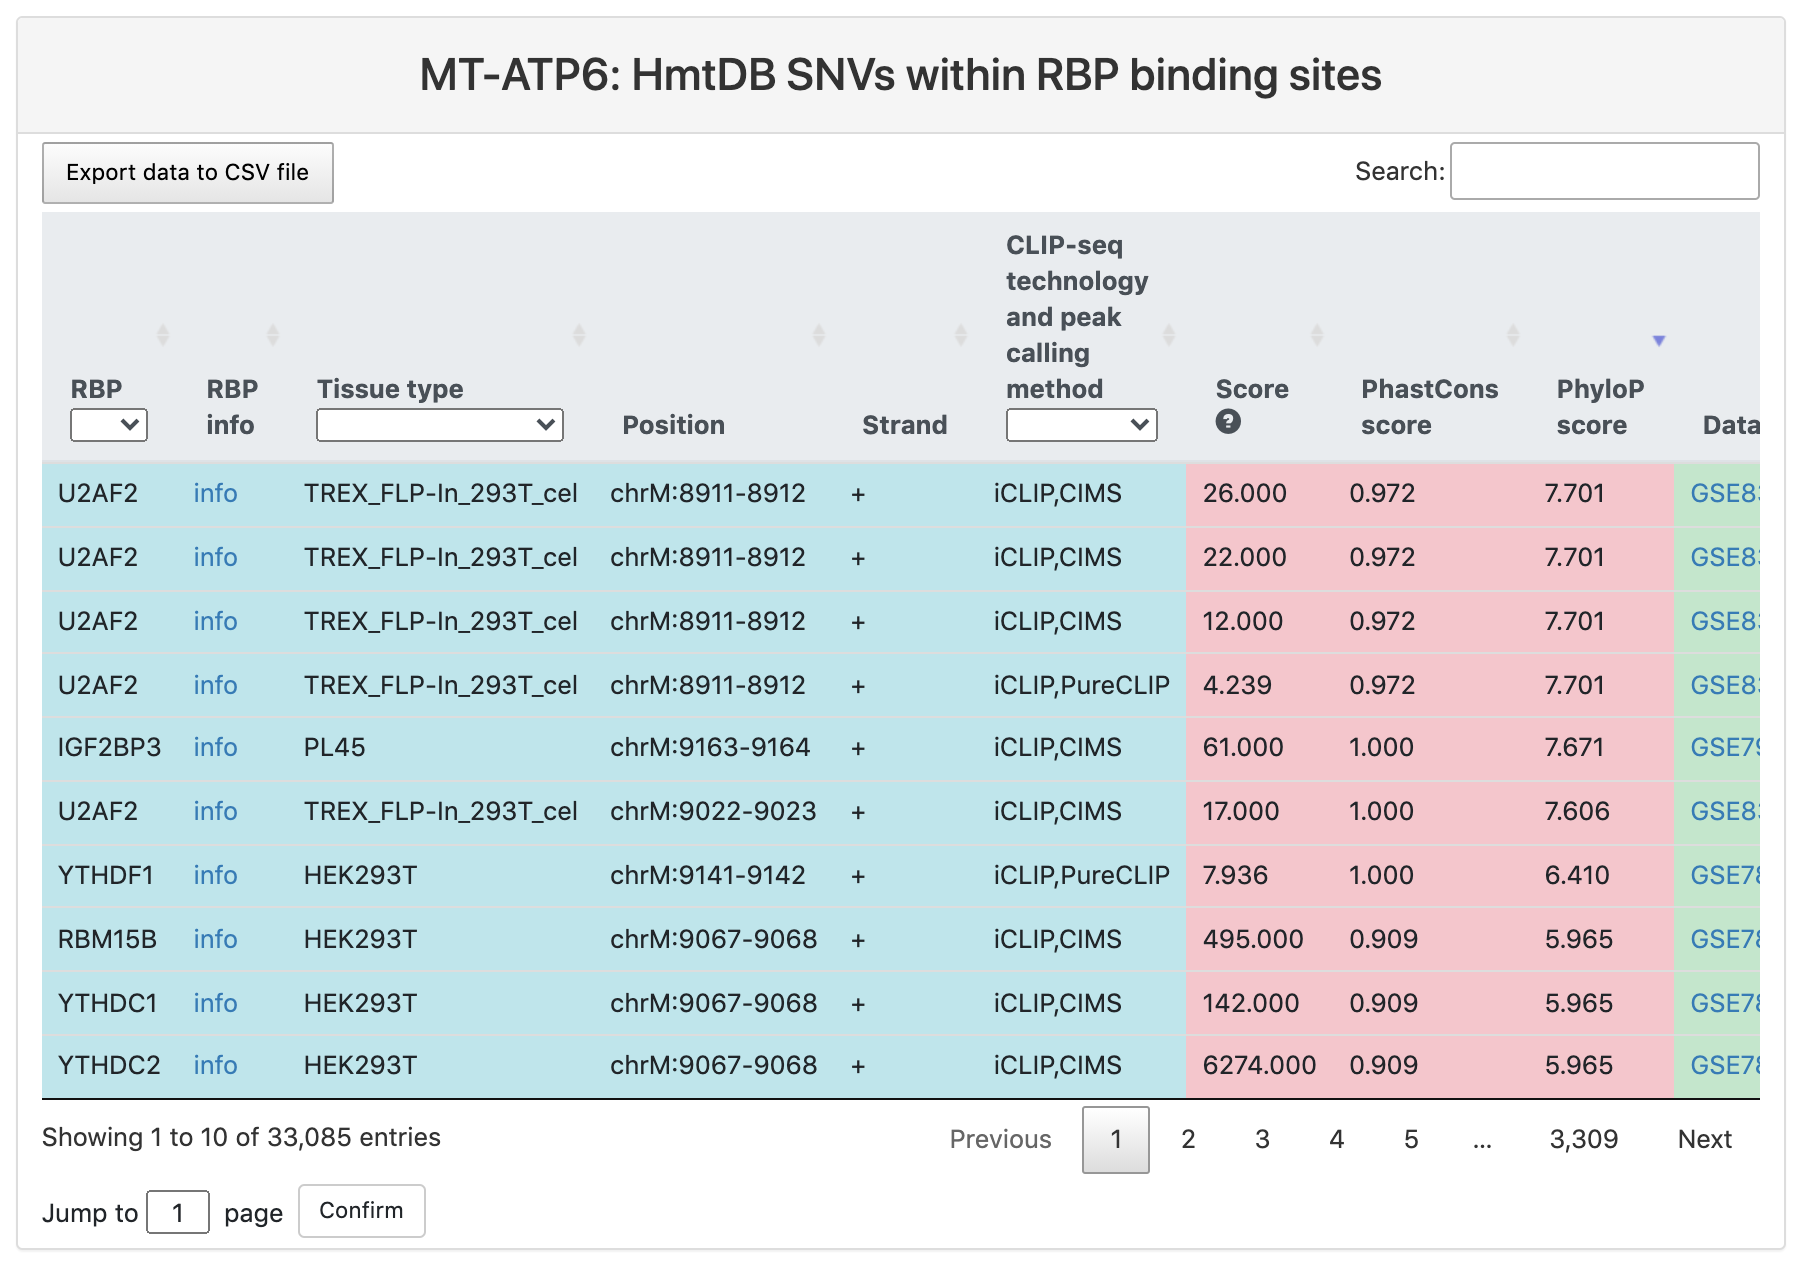
This section provides a tabular view of SNP sites from HmtDB within RBP binding sites.
The explanations of column 1-10 are the same of above table. And the explanations of other columns are here:
- Ref: reference genomic allele (+).
- Alt: corresponding alternative allele (+).
- Position: genomic location of the SNP site.
- Significance: significance of this SNP in disease.
POSTAR3 Central
On the bottom of this module, we provided a link to a "POSTAR3 Central" web page, providing an RNA-centric view of our database. Users could transfer to other modules and search for the same gene in the same species by clicking the link in this page
Input
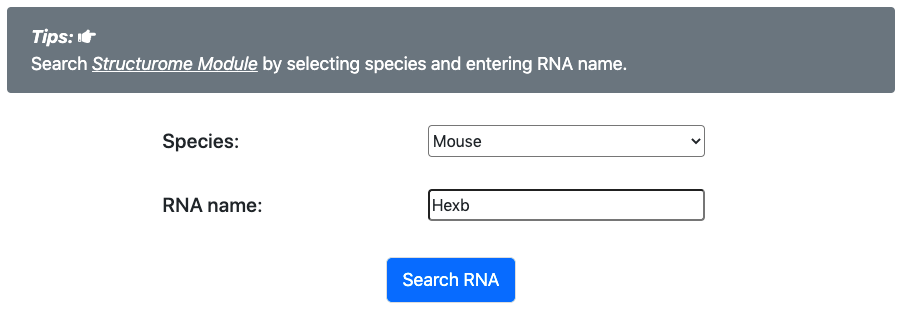
- Firstly, user should specify a species (human, mouse, zebrafish, fly, worm, Arabidopsis, or yeast), and enter an RNA name of that species.
Result
Genome browser
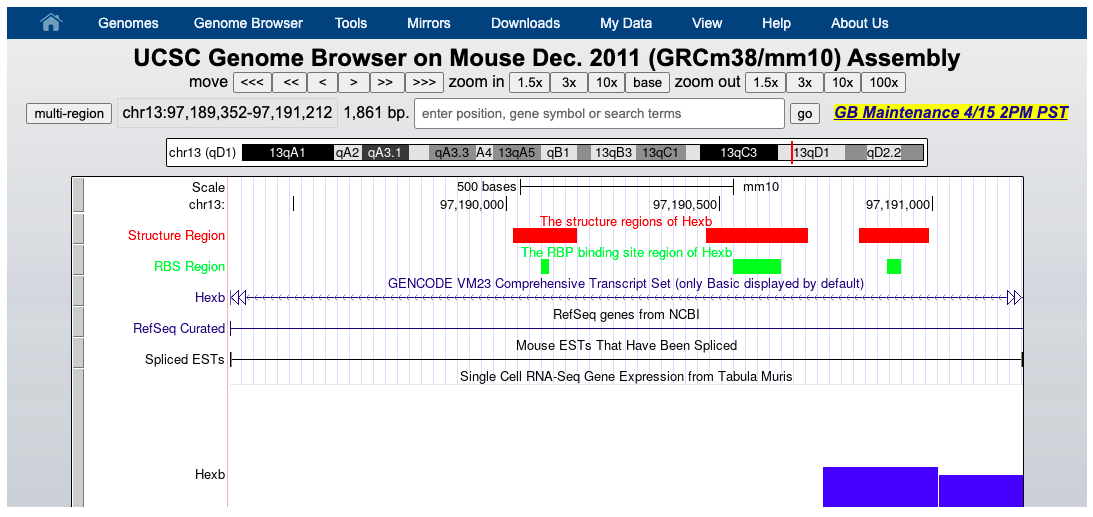
This section provides embedded genome browser web page of the RBP binding region and corresponding extended structure region. Other tracks could be specified by the user.
Interaction network
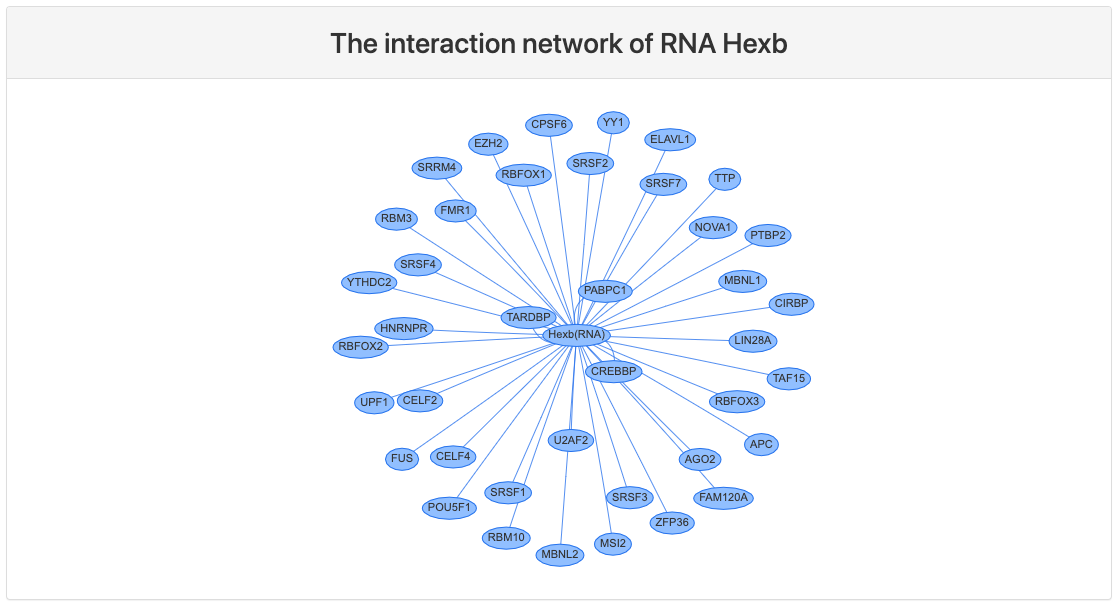
This section provides network view of interactions between the query RNA and RBPs that bound to this RNA.
Structure information of RBP binding sites
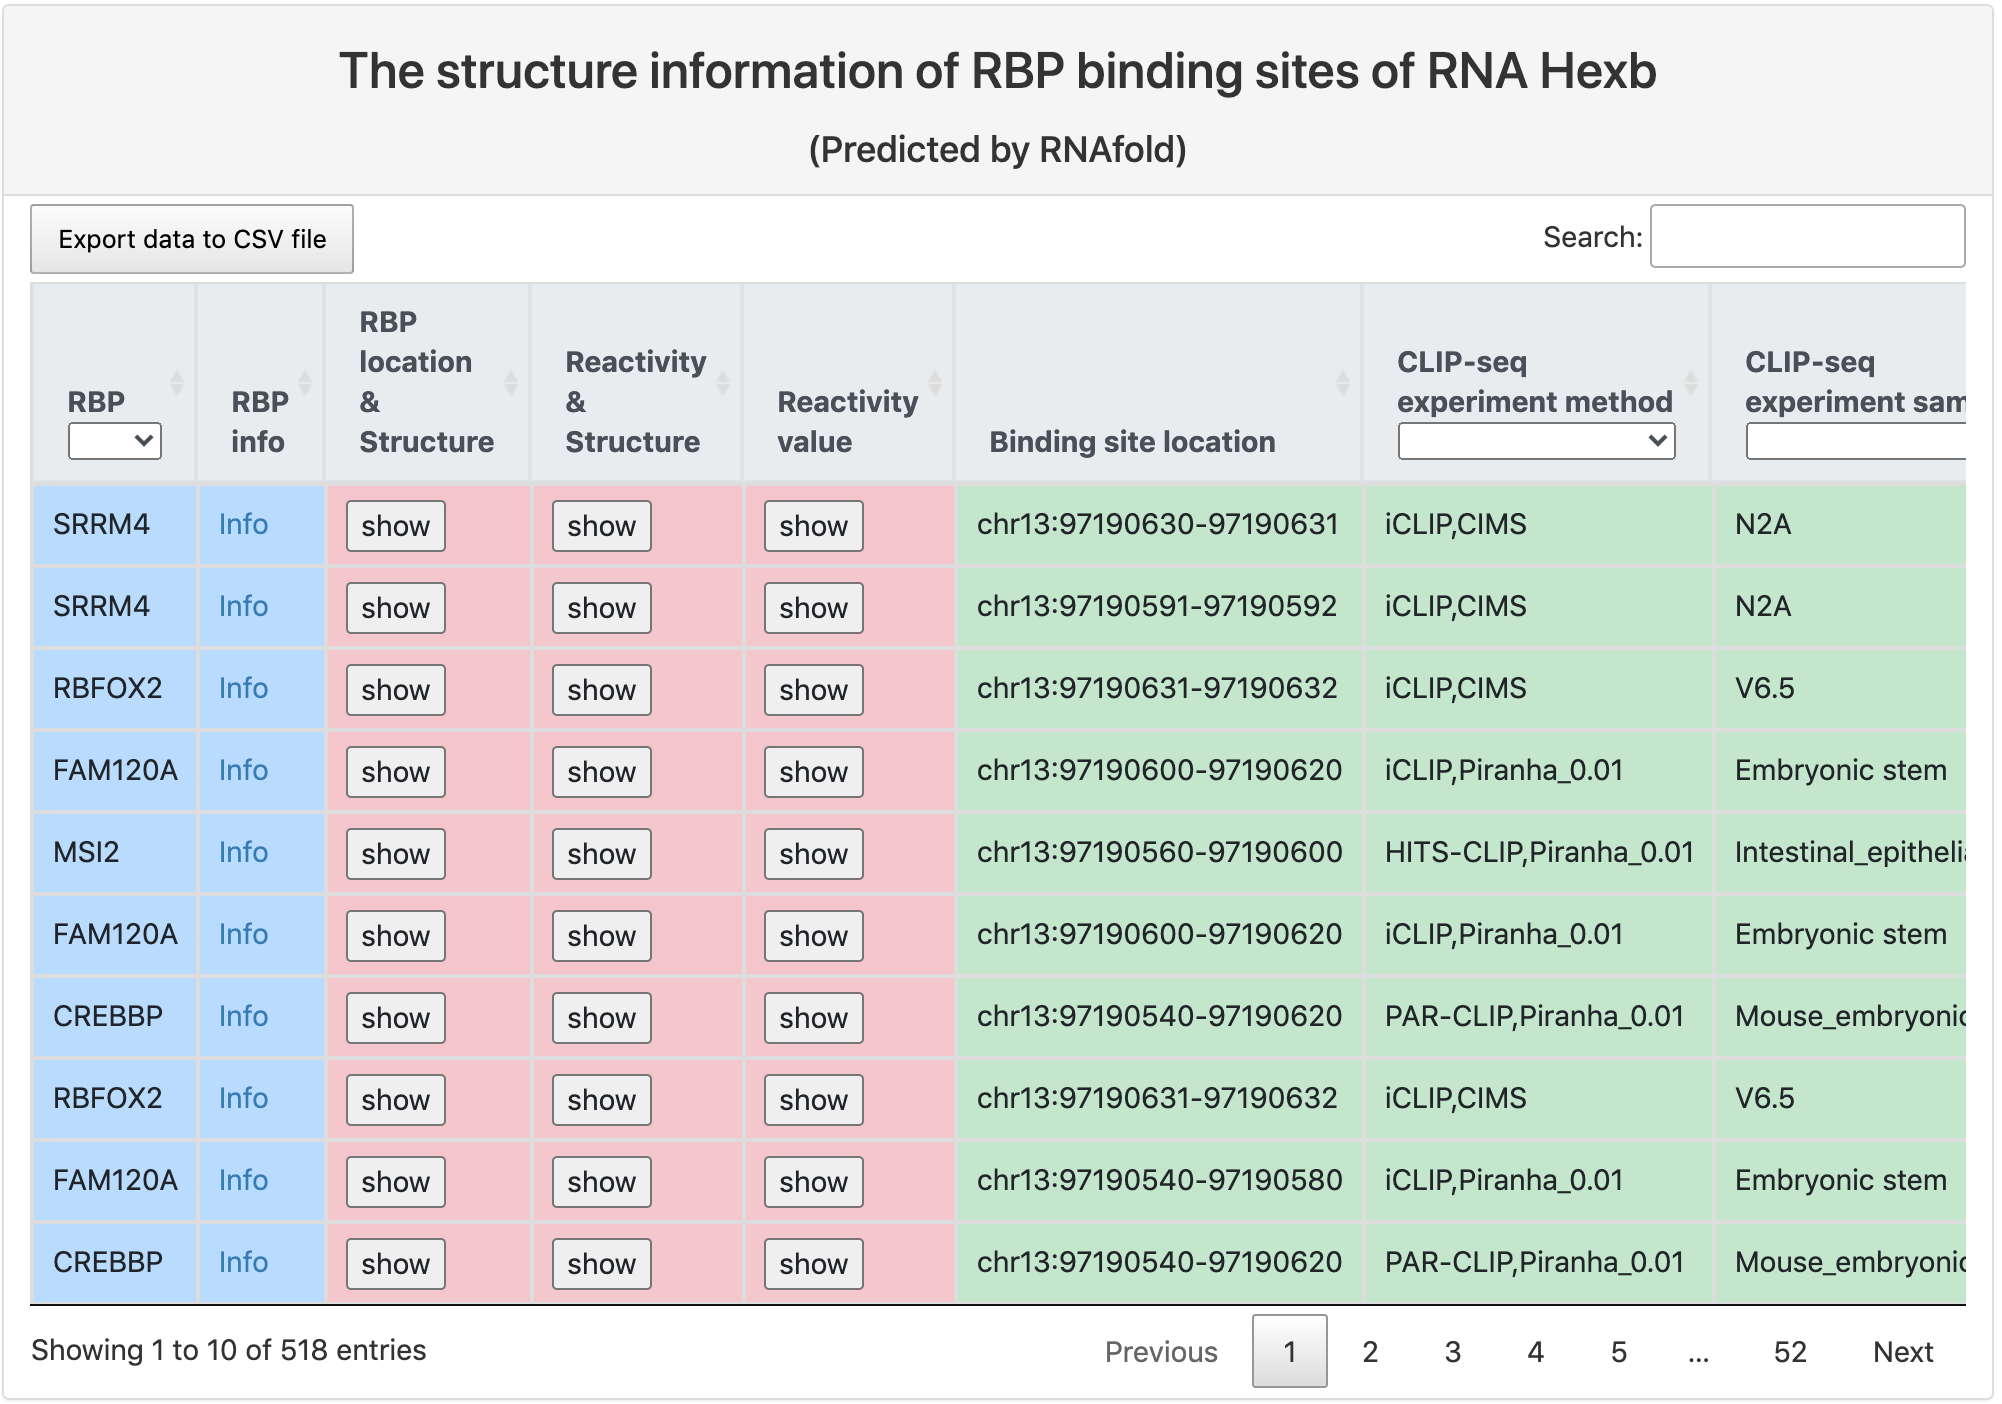
This section provides tabular view of all RBP binding sites on the query RNA, and their structure information.
Here is an explaination of each column:
- RBP: RBP gene symbol, and a link to the summary page of this RBP.
- RBP info: a link to the summary page of this RBP.
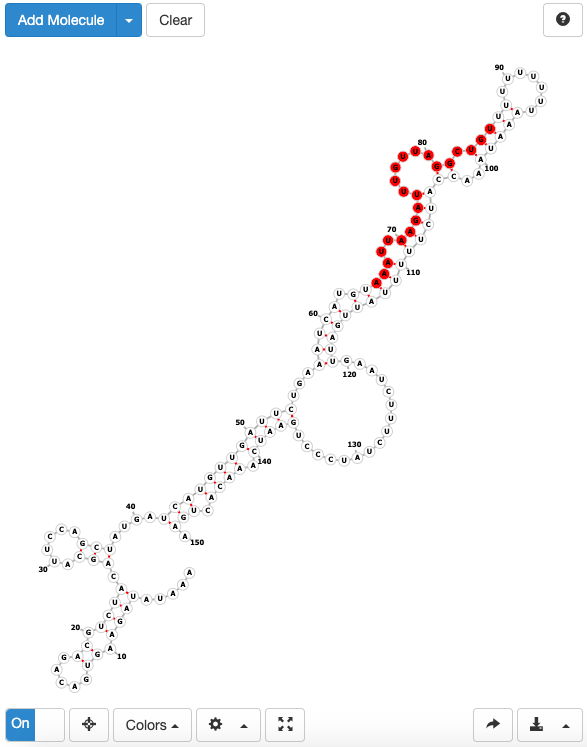
- RBP location & structure: a link to a forna page which displays the calculated RNA secondary structure around the binding site position, with binding sites position highlighted in red.
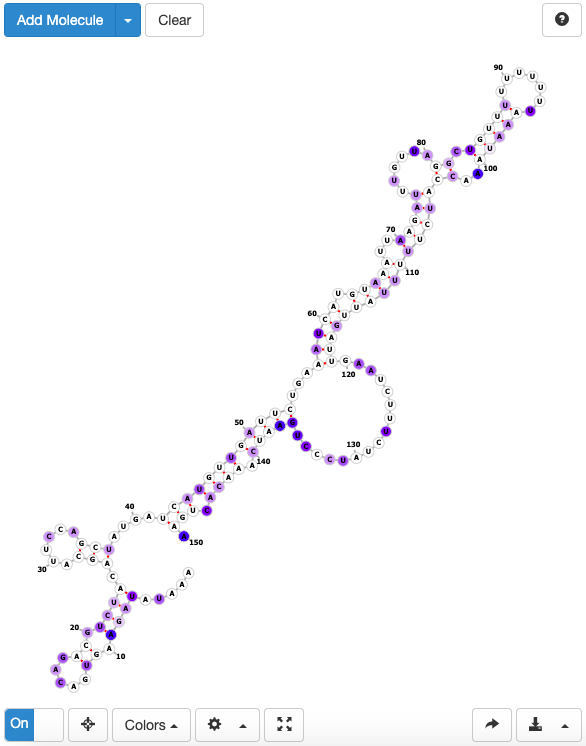
- Reactivity & structure: a link to a forna page which displays the calculated RNA secondary structure around the binding site position, with higher reactivity value indicated in darker blue.
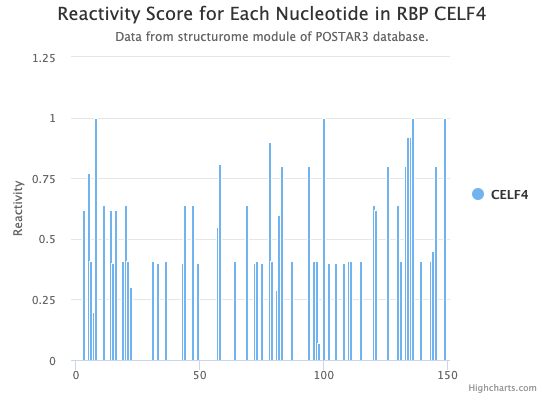
- Reactivity value: a link to a bar chart of reactivity value around the RBP binding sites.
- Binding site location: the position of the RBP binding site.
- CLIP-seq experiment method: CLIP-seq technology and peak calling method.
- CLIP-seq experiment sample: tissue type where the RBP binding sites were identified.
- CLIP-seq experiment source: data accession number and a link to the database.
- Binding site score: RBP binding score calculated by the peak calling method.
- PhastCons score: the mean conservation scores for the RBP binding sites using genome-wide phastCons intensities.
- Phylop score: the mean conservation scores for the RBP binding sites using genome-wide phyloP intensities.
- Structurome experiment method: RNA secondary structure profiling technology and structure modeling software.
- Structurome experiment sample: tissue type and experiment condition of RNA secondary structure profiling experiment.
POSTAR3 Central
On the bottom of this module, we provided a link to a "POSTAR3 Central" web page, providing an RNA-centric view of our database. Users could transfer to other modules and search for the same gene in the same species by clicking the link in this page
Input
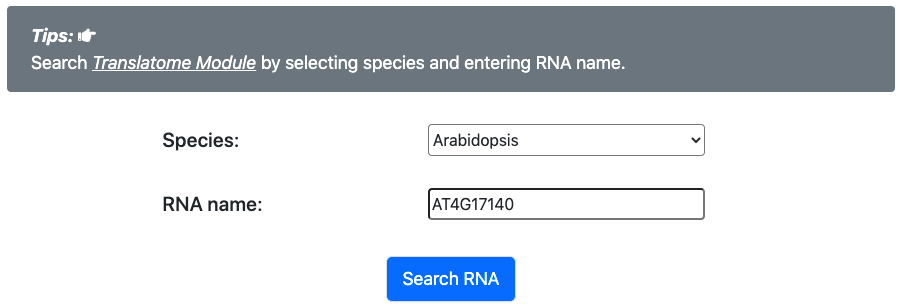
- Firstly, user should specify a species (human, mouse, fly, worm, Arabidopsis, or yeast), and enter an RNA name of that species.
Result
Translatome summary
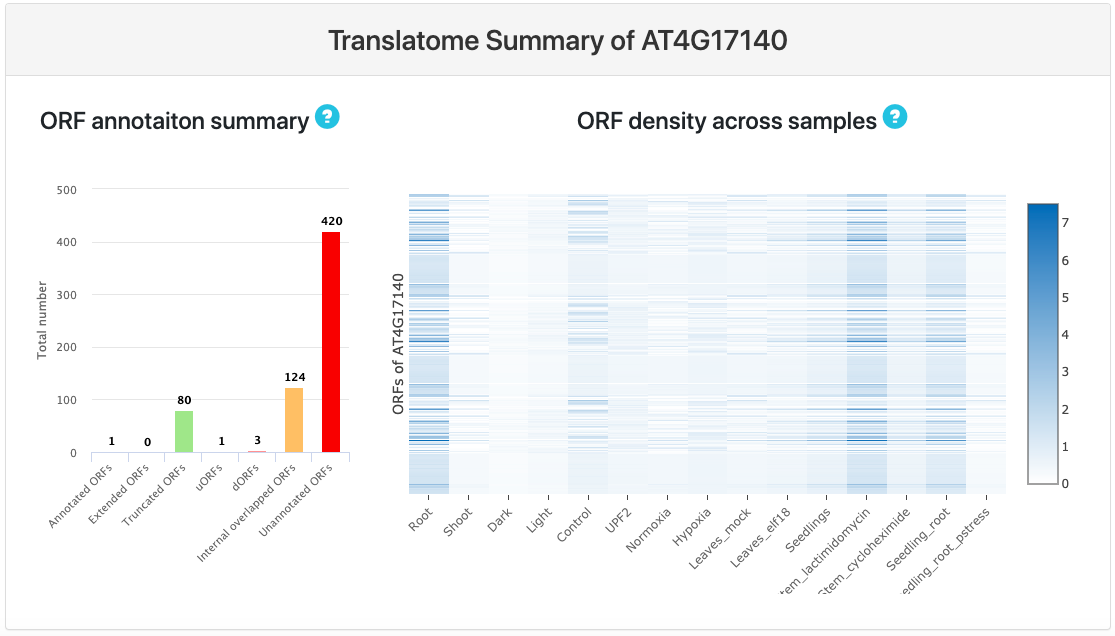
This section provides user with two plots: On the left there is a bar plot showing the total number of all categories of ORFs. Based on given annotation, ORFs are further categorized into different groups. The number on the top of each bar represents the number of ORFs falling in the corresponding ORF category.
The explanation of different ORF categories is as following:
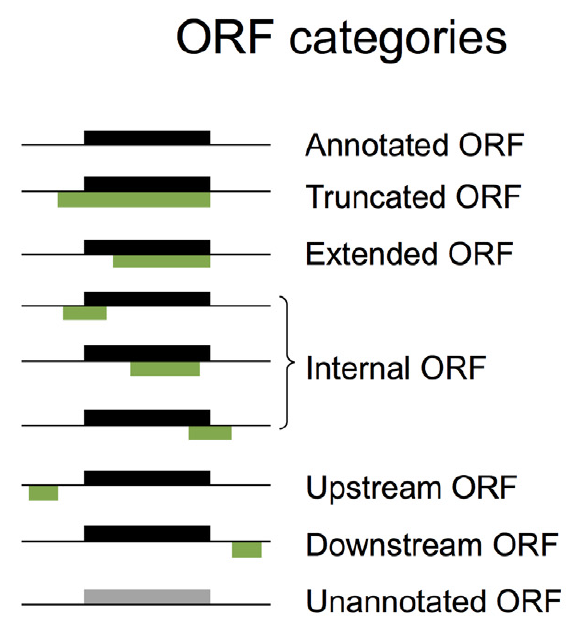
- Annotated ORFs(aORFs): ORFs that are annotated by reference.
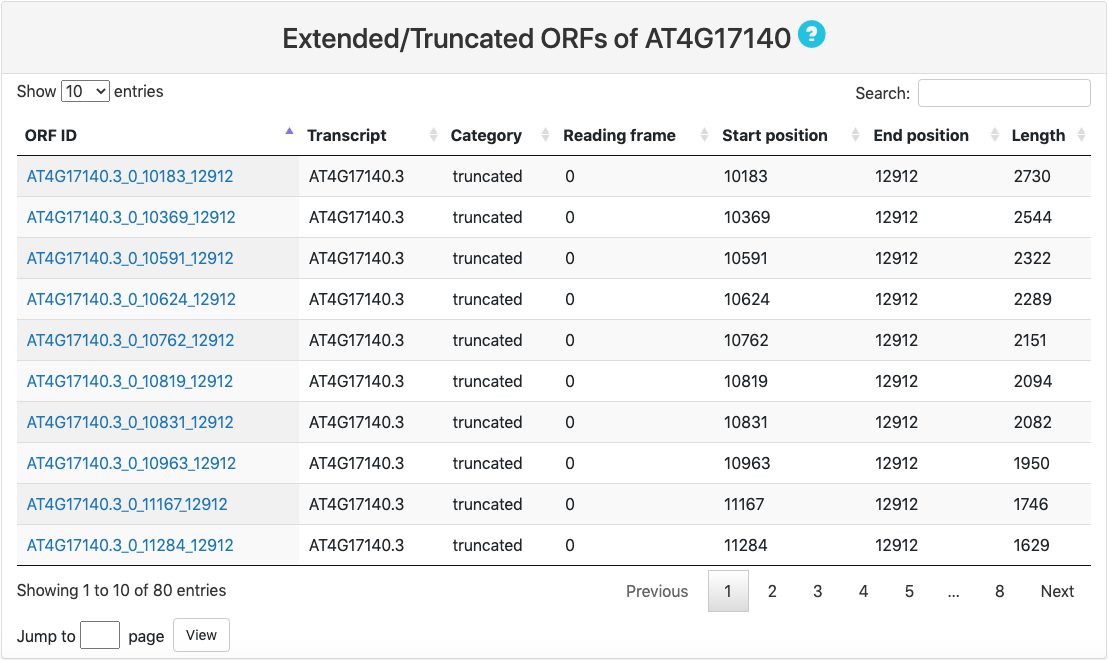
- Extended ORFs/Truncated ORFs: ORFs that are of the same stop codon as aORFs but have different translation initiation sites.
- Upstream ORFs(uORFs)/downstream ORFs(dORFs): ORFs that are located upstream/downstream of one aORF.
- Internal overlapped ORFs: ORFs that are within different reading frame as the aORFs but have overlapping with the aORFs.
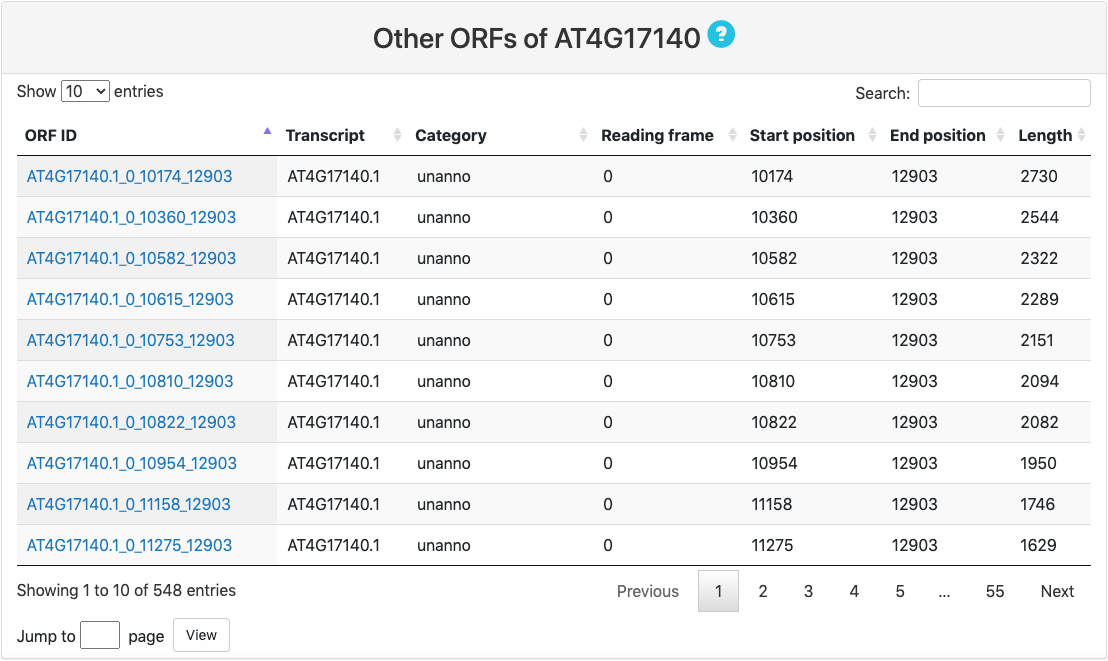
- Unannotated ORFs: ORFs without any annotation.
- In the right panel, there is a heatmap showing ORF density across different experiments and samples.
Annotated ORFs
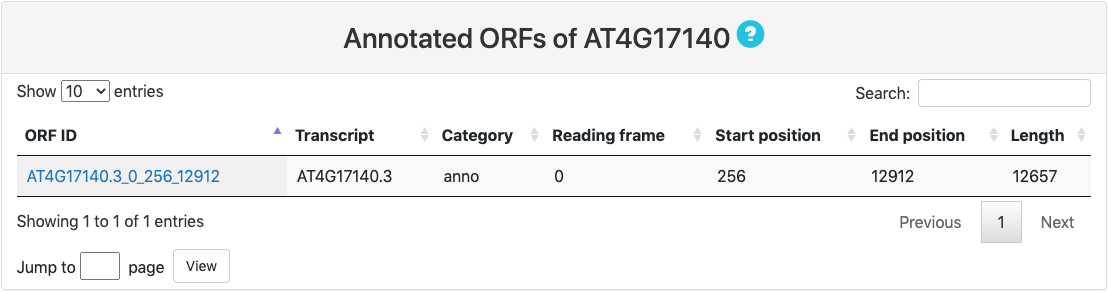
This section provides tabular view of all aORFs for the query RNA.
Here is an explaination of each column:
- ORF ID: ORF ID is named based on the composition of transcript, reading frame, translation start sites and stop sites.
- Transcript: transcript ID.
- Category.
- Reading frame: reading frame is counted based on the relative distance between transcript start sites (TSS).
- Start position: start position is numbered based on the relative position of translation initiation sites along the transcript.
- End position: end position refers to the last nucleotide of ORF along the transcript.
- Length: length of ORF.
Extended/Truncated ORFs
Other ORFs
Detail information on each ORF
Clicking the link in ORF ID will open new web page displaying detailed information on each ORF, including translation efficiency, ORF density, identified translated region, and signal track demonstration.
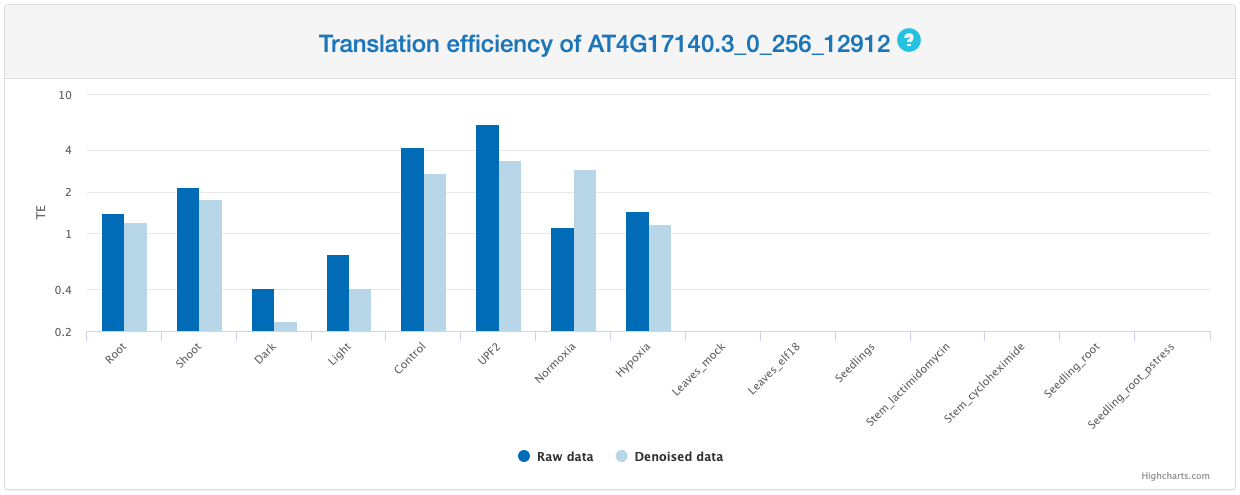
Translation efficiency
This section provides a bar chart that summarized TE calculated based on either original signal of Ribo-seq or denoised periodic signal of Ribo-seq across different samples. TE is defined as the ratio between Ribo-seq RPKM and RNA-seq RPKM.
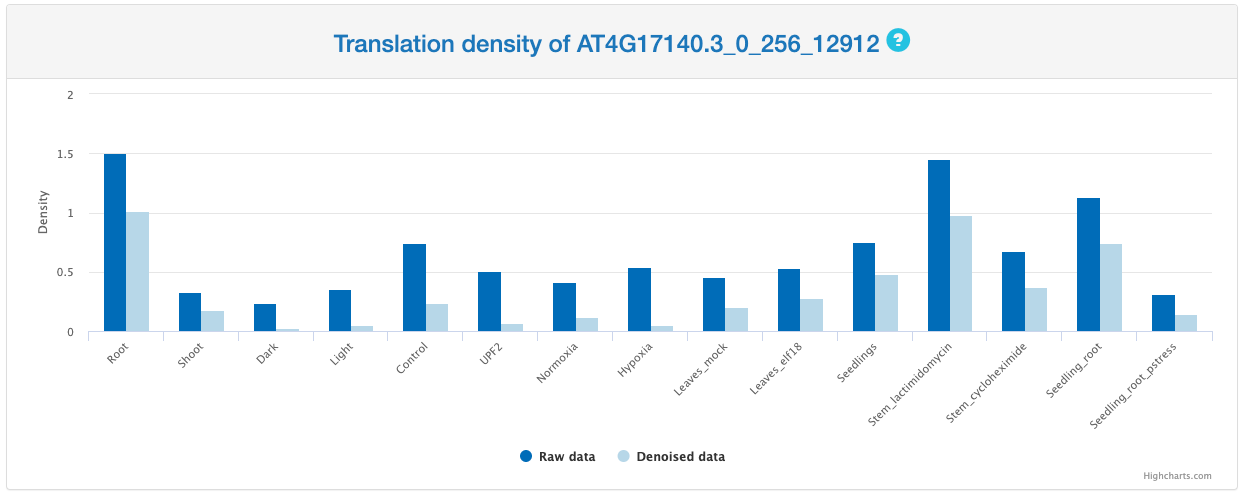
Translation density
This section provides a bar chart that summarizes Ribo-seq reads density of selected ORF across different samples. Translation density is defined as the average reads intensity within the ORF.
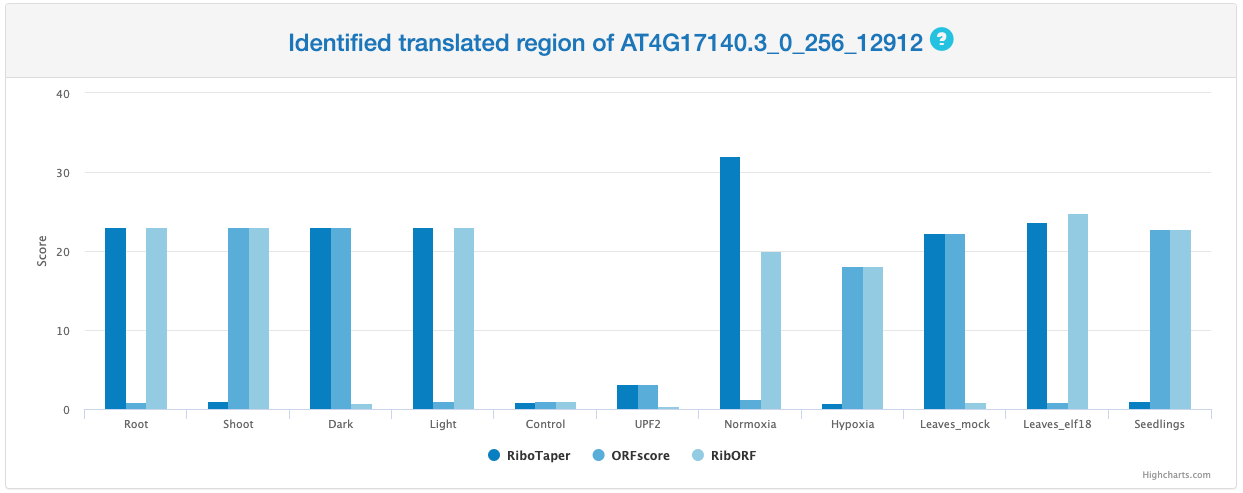
Identified translated region
This section provides a bar chrat that summarized scores calculated by RiboTaper, ORFscore, and RibORF. The number on the top of each bar represents the calculated output for each method among different samples. For RiboTaper, the output is presented in the format of -1 * log(p-value) in which p-value < 0.05 (or -1 * log(p-value)> 2.996) indicates the potential of active translation. Similarly, the output of ORFscore requires its value higher than 6.044 to indicate active translation and RibORF requires its score higher than 0.7.
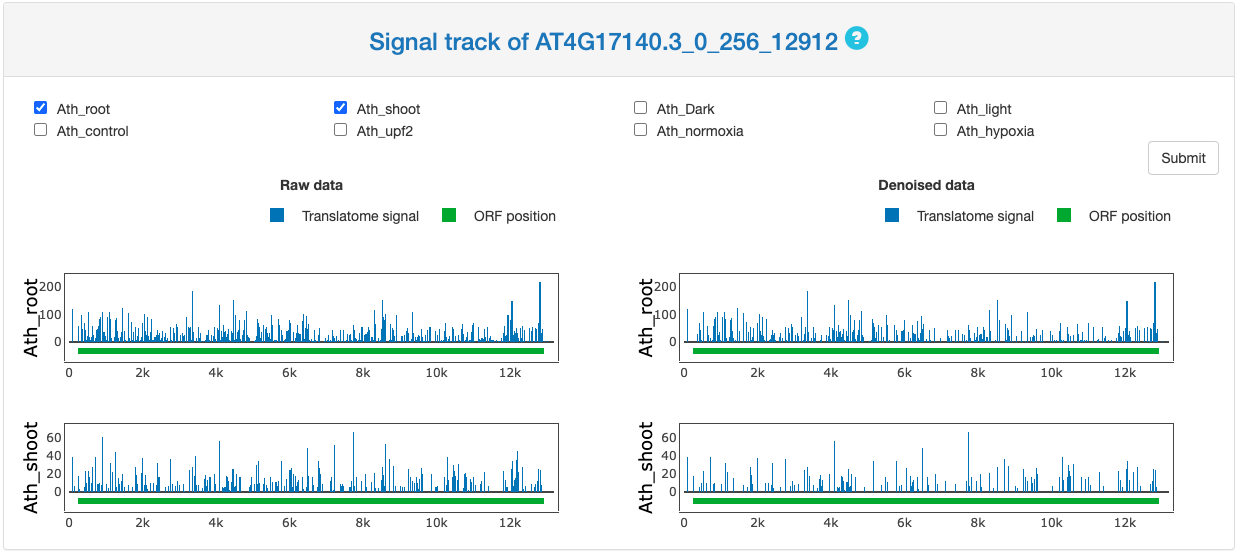
Signal track demonstration
This section provides the signal track of Ribo-seq data for either original signal or the denoised periodic footprint. In this part, user can specify multiple datasets at the same time. The signal track is presented along the transcript with the studied ORF highlighted in green on the bottom. Ribo-seq signals are colored in blue.
POSTAR3 Central
On the bottom of this module, we provided a link to a "POSTAR3 Central" web page, providing an RNA-centric view of our database. Users could transfer to other modules and search for the same gene in the same species by clicking the link in this page
Search target RNA-Input
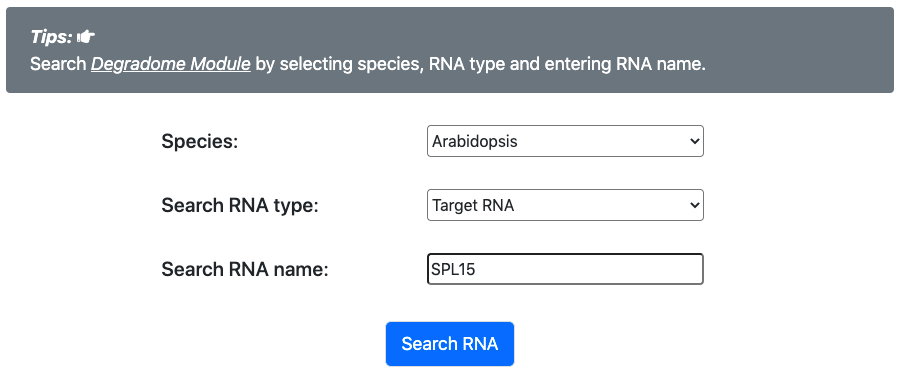
- Firstly, user should specify a species (human, mouse, fly, Arabidopsis), and enter a target RNA name of that species.
Search target RNA-Result
Interaction network
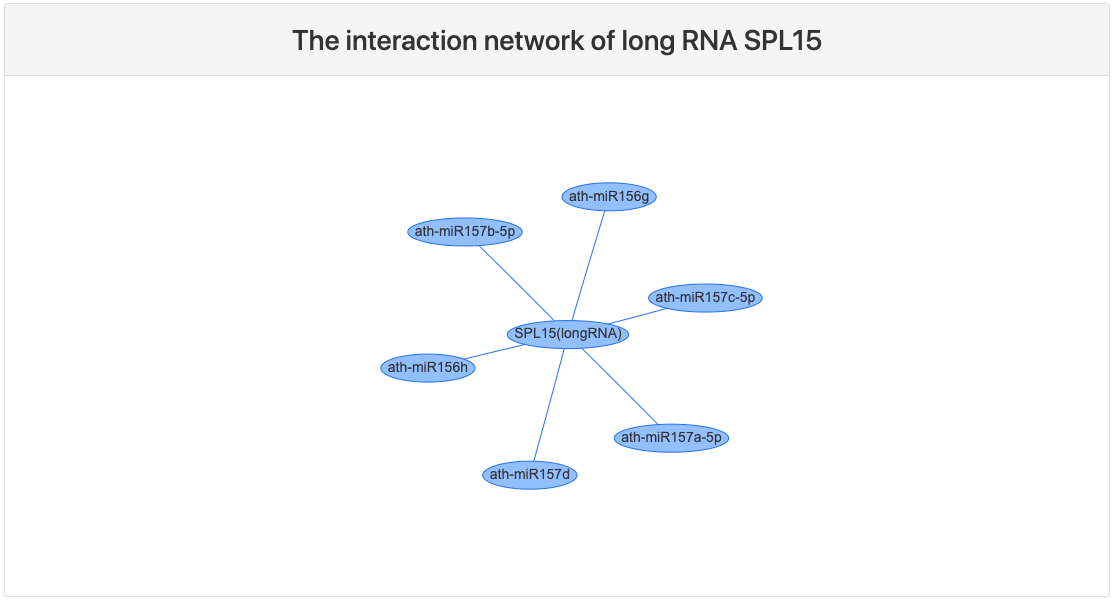
This section provides a network view of the query RNA and interacting small RNAs.
Degradome information
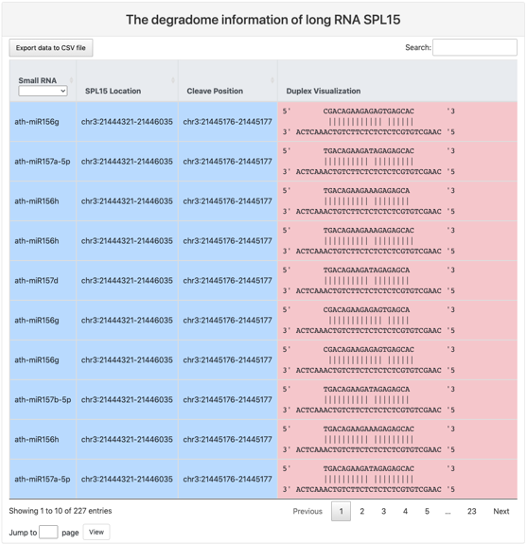
This section provides a tabular view of the query RNA and interacting RNAs.
Here is an explaination of each column:
- Small RNA: miRBase ID for the interacting miRNA.
- target RNA Location: genome location of the target RNA with a botton to an embedded genome browser.
- Cleave Position: genome location of the cleavage position.
- Duplex visualization: a graph demonstrating the binding duplex between target RNA and interacting small RNA.
- Category: category of the identified binding.
- 0: peaks that have greater than one read and are the maximum on the transcript where there is only one maximum.
- 1: peaks that have greater than one read and are the maximum on the transcript, but there is more than one maximum.
- 2: peaks that have greater than one read and are above the average fragment abundance on the transcript.
- 3: peaks that have greater than one read and are below or equal to the average fragment abundance on the transcript.
- Norm. miRNA Abundance: normalized miRNA abundance in the sRNA-seq data.
- Norm. target Abundance: normalized target RNA abundance in the degradome-seq data.
- Duplex MFE: minimal free energy of the actual binding duplex.
- MFE ratio: ratio of actual MFE value to theoretical MFE.
- P value: p value of degradome duplex calculated by PAREsnip2.
- Protocol: experiment protocol of degradome-seq.
- Tissue type: tissue type where the degradome-seq was performed.
- Treatment: treatment of the degradome-seq experiment.
- Source: data accession of the degradome-seq.
POSTAR3 Central
On the bottom of this module, we provided a link to a "POSTAR3 Central" web page, providing an RNA-centric view of our database. Users could transfer to other modules and search for the same gene in the same species by clicking the link in this page
Search small RNA-Input
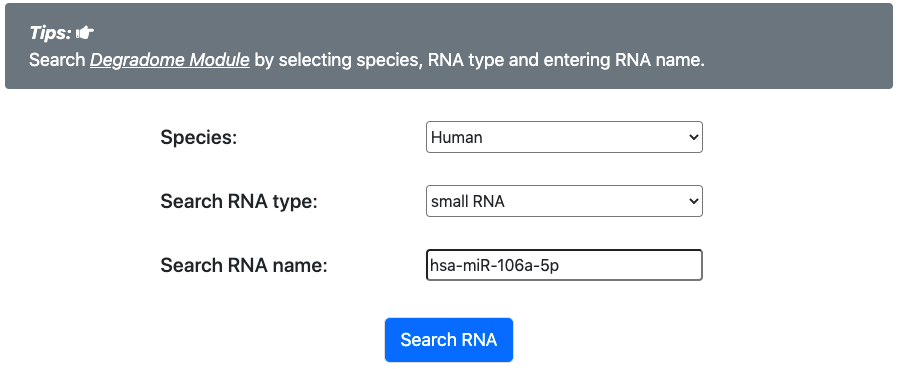
- Firstly, user should specify a species (human, mouse, fly, Arabidopsis), and enter a small RNA name of that species.
Search small RNA-Result
Basic information
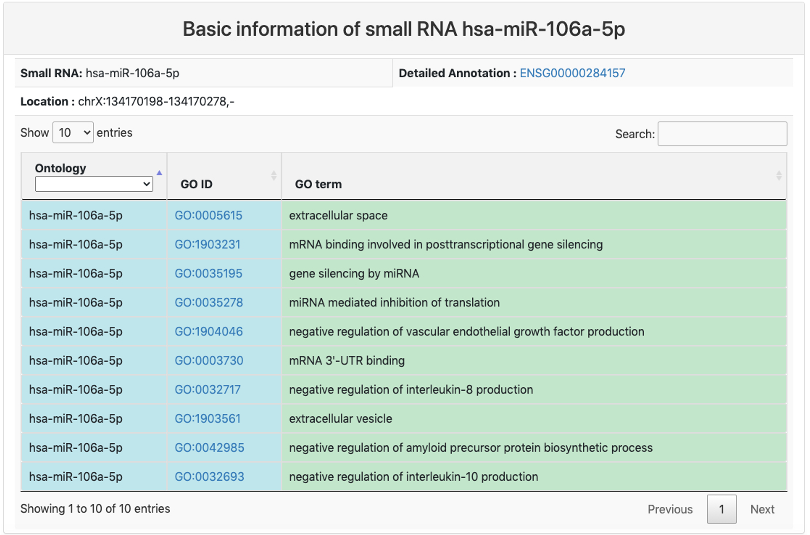
This section provides basic information of small RNA. It includes:
- Small RNA: miRBase ID of the small RNA.
- Detailed Annotation: geneID of the small RNA with a link to Ensembl database.
- Location: genome location of the small RNA.
- GO ontology of the small RNA.
Interaction network
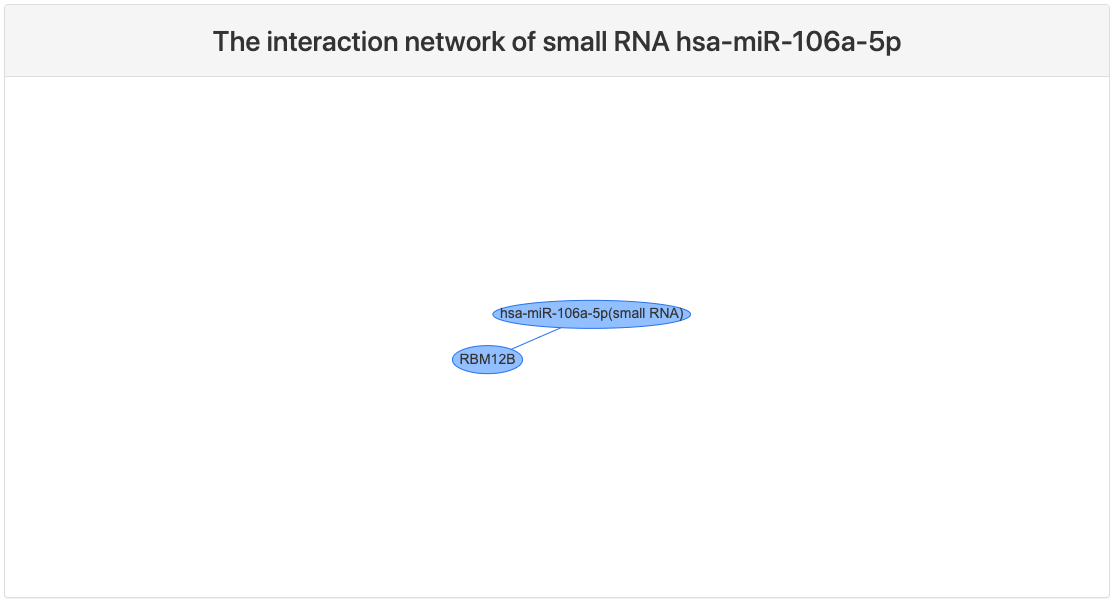
This section provides a network view of the query small RNA and interacting RNAs.
Degradome information
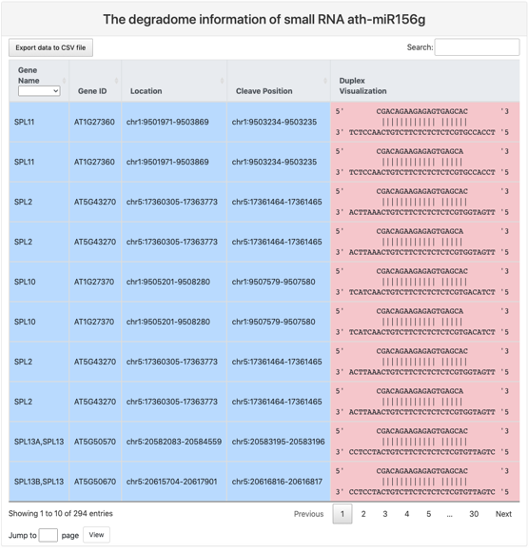
This section provides a tabular view of the query small RNA and interacting RNAs.
Here is an explaination of each column:
- Gene Name: gene symbol for the interacting RNA.
- Gene ID: gene ID for the interacting RNA.
- Location: genome location of the target RNA with a botton to an embedded genome browser.
Other columns are the same as in target RNA search page.
POSTAR3 Central
On the bottom of this module, we provided a link to a "POSTAR3 Central" web page, providing an RNA-centric view of our database. Users could transfer to other modules and search for the same gene in the same species by clicking the link in this page